Responsibilities
I was the primary developer responsible for the migration of a forecasting process from the SAS platform to the R / Python platform.
The Migration Project
What are we trying to accomplish?
This project involved a micro-simulation at the farm level of revenue and expense data by commodity, which were aggregated to forecast net operating income and balance sheet information at multiple aggregate levels.
The challenges of this project
- Tens of thousands of lines of legacy SAS code written by multiple people over many years.
- Little documentation, and few people who knew the whole project.
- Implementing optimised R / Python code to mimic the performance characteristics of SAS code which has been optimised over many years.
- Determining the accuracy of the forecast in a simulation where there are going to be differences in the results.
From SAS to R
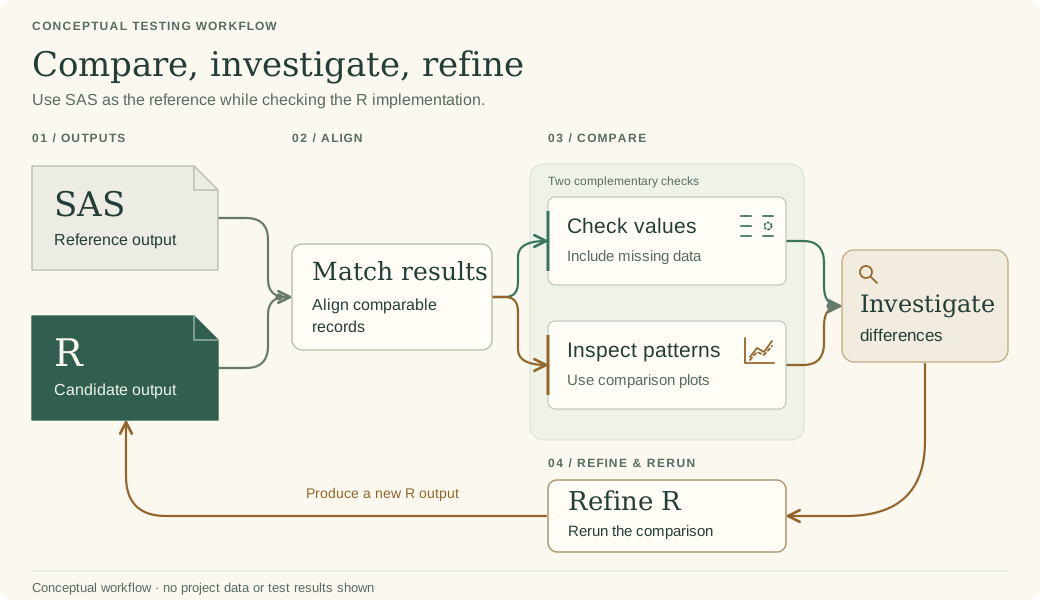
Reproducible results, with the aim of matching SAS performance.
Refine the implementation. Rerun both checks.
My contribution to this project
The primary developer responsible for the migration
I was responsible for gaining an understanding of the SAS algorithms and converting them to R / Python. This involved writing tens of thousands of lines of R / Python code.
I primarily used the Tidyverse platform, which is a collection of R packages designed for data science.

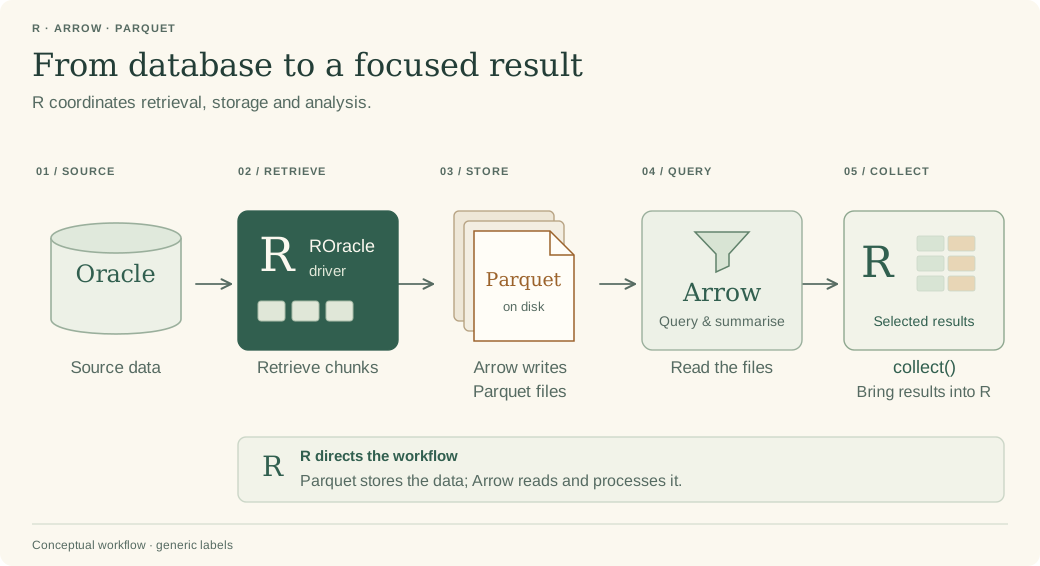
Increasing the performance of the connection between R and the Oracle database
I compiled and installed the ROracle package from source, replacing the ODBC connection with much faster data access between R and Oracle.
For datasets too large to fit in memory, we used Arrow’s R integration to work efficiently with data on disk.
Increasing the performance of the R code
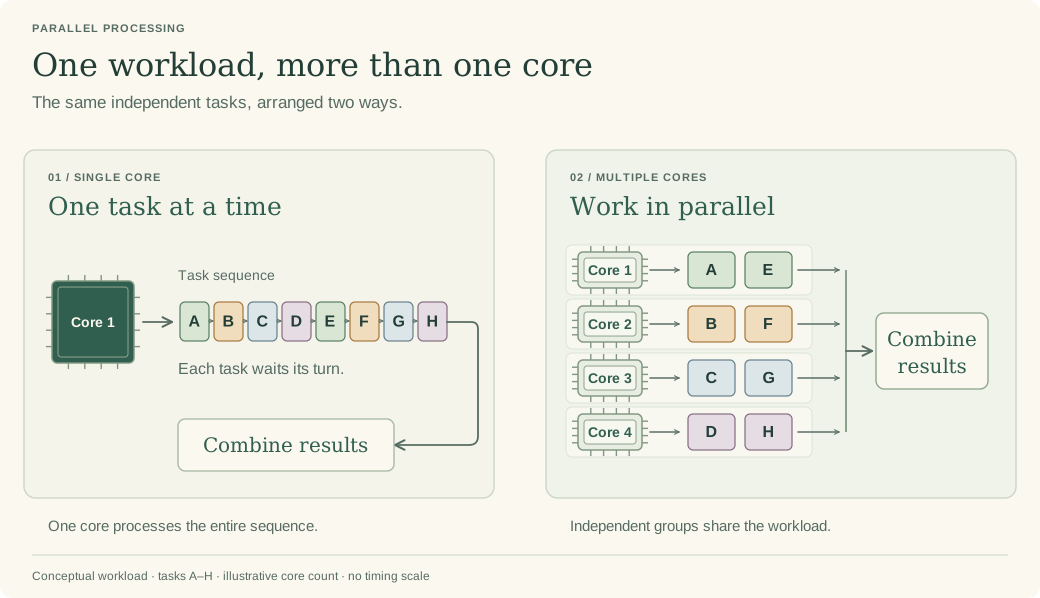
To match or get close to the performance advantages of SAS, I used the vectorisation features of the Tidyverse ecosystem, such as dplyr and purrr.
To further take advantage of modern multi-core processors, we used the furrr package to split the workload across multiple cores, so that tasks that had been taking hours to run completed within minutes.
Ensuring the accuracy of the migration
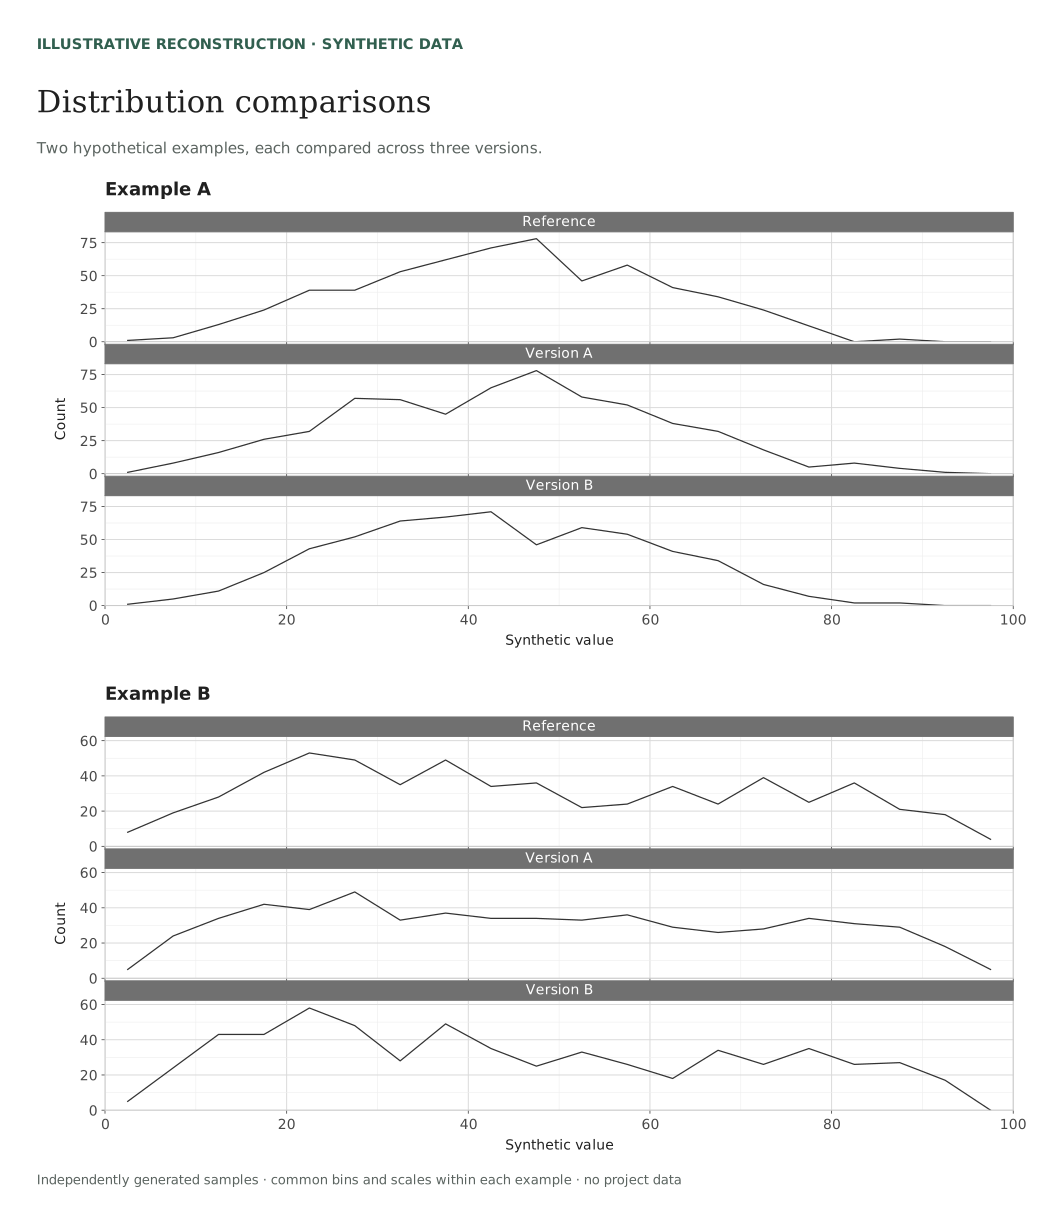
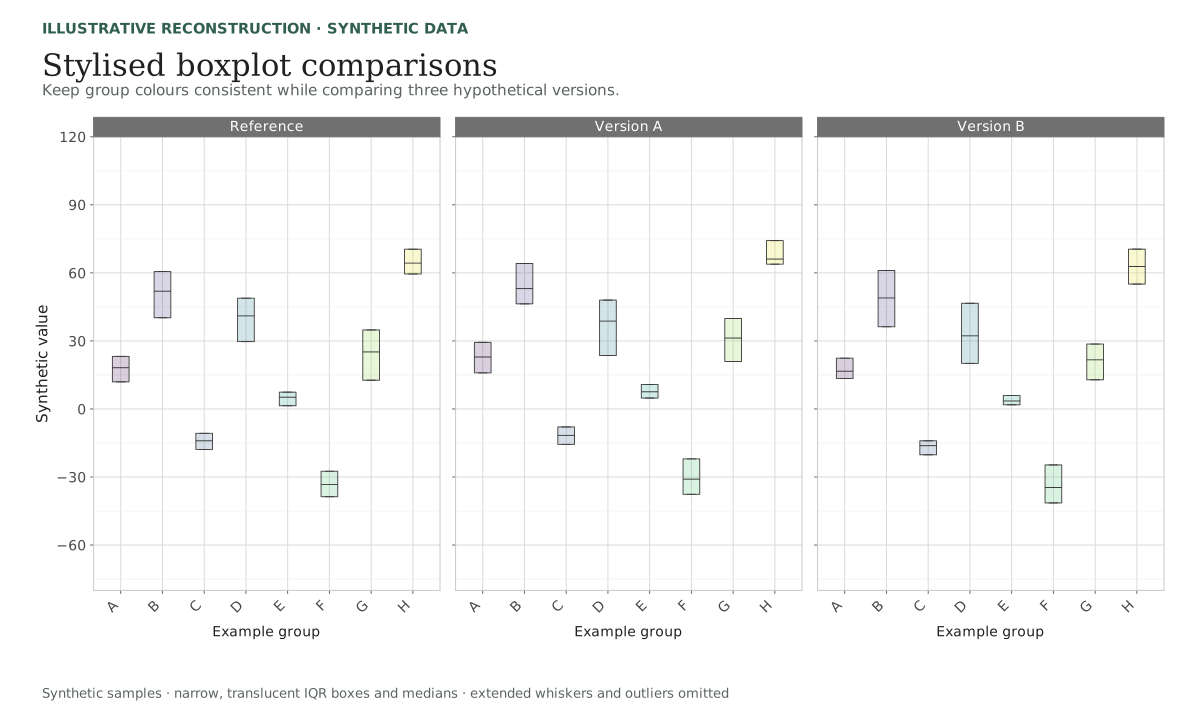
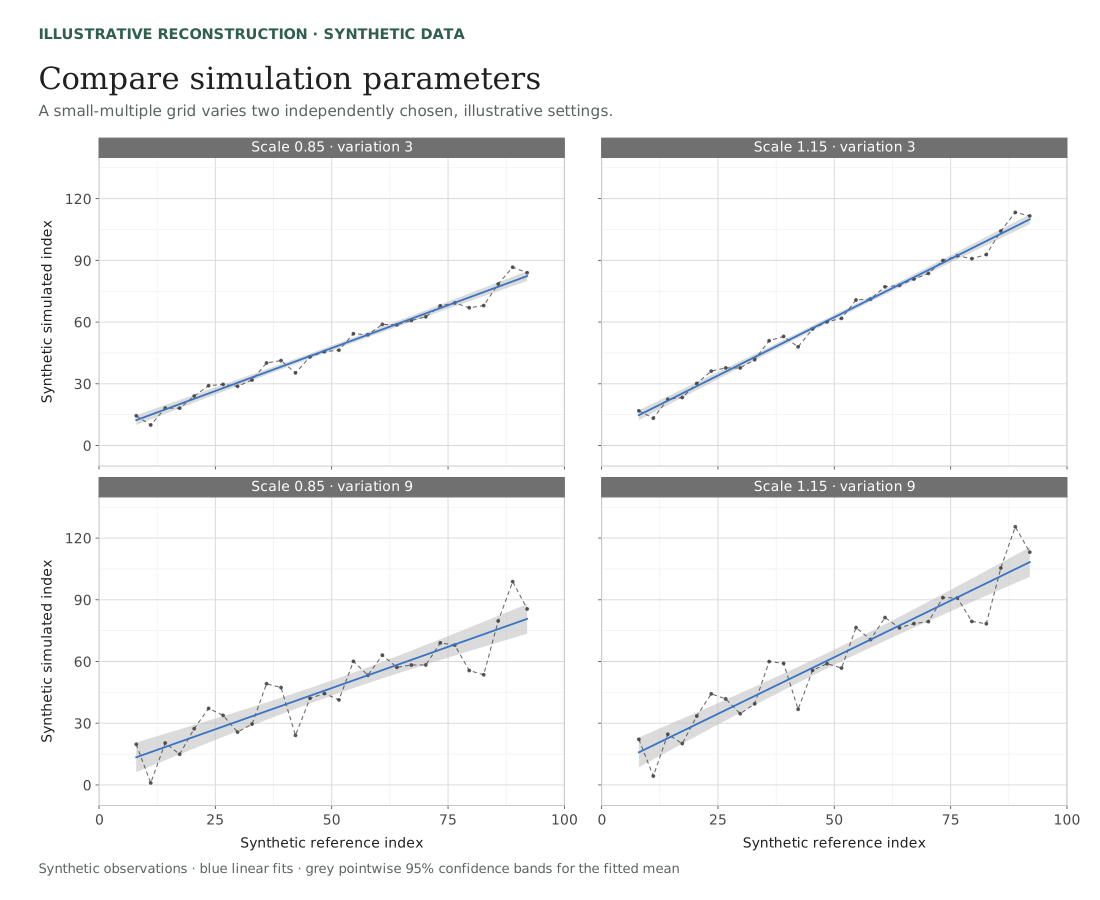
I used tests and ggplot2 comparisons to check the migrated calculations, investigate differences and refine the implementation.
The charts below recreate the style of those comparisons using synthetic data.
Solving non-trivial problems
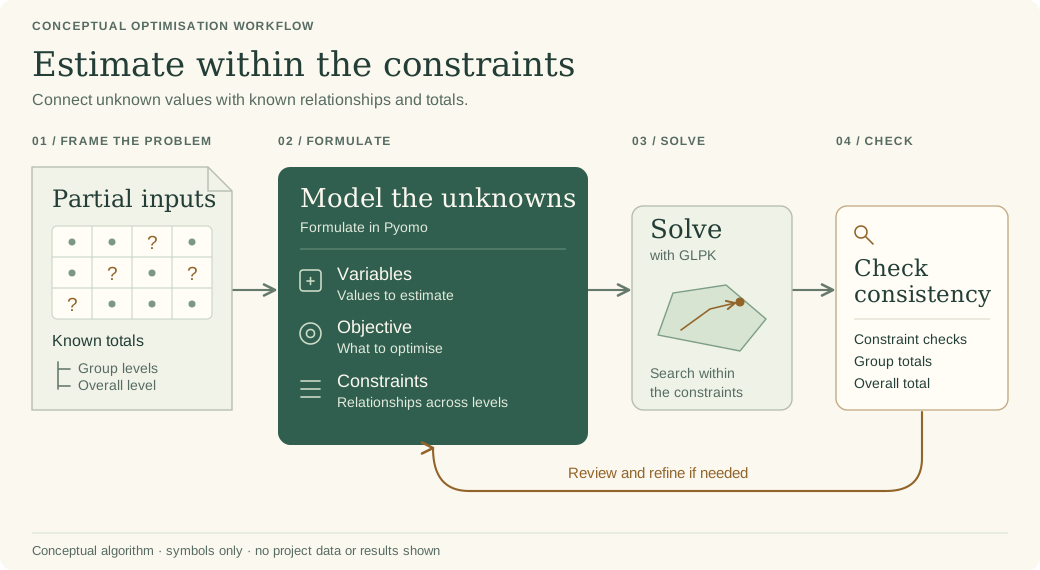
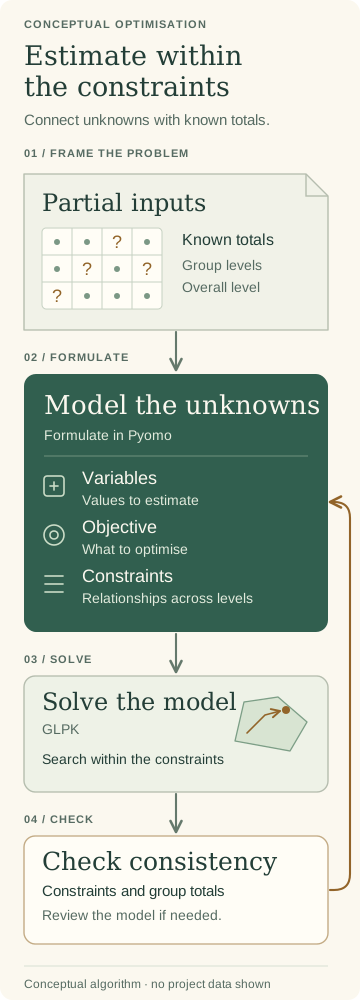
I used optimisation to address gaps in data while working across multiple levels of aggregation.
I formulated the model in Python using Pyomo and solved it with the GNU Linear Programming Kit (GLPK).
Continuous Learning
Miscellaneous Projects
I try to keep my skill set up to date and use learning resources such as Udemy and DataCamp to learn new ways of solving problems. In addition, I like to discuss problems and potential solutions with my colleagues and learn from their experiences and solutions. Some interesting projects that I have worked on:
- Polars, a high-performance Python DataFrame library.
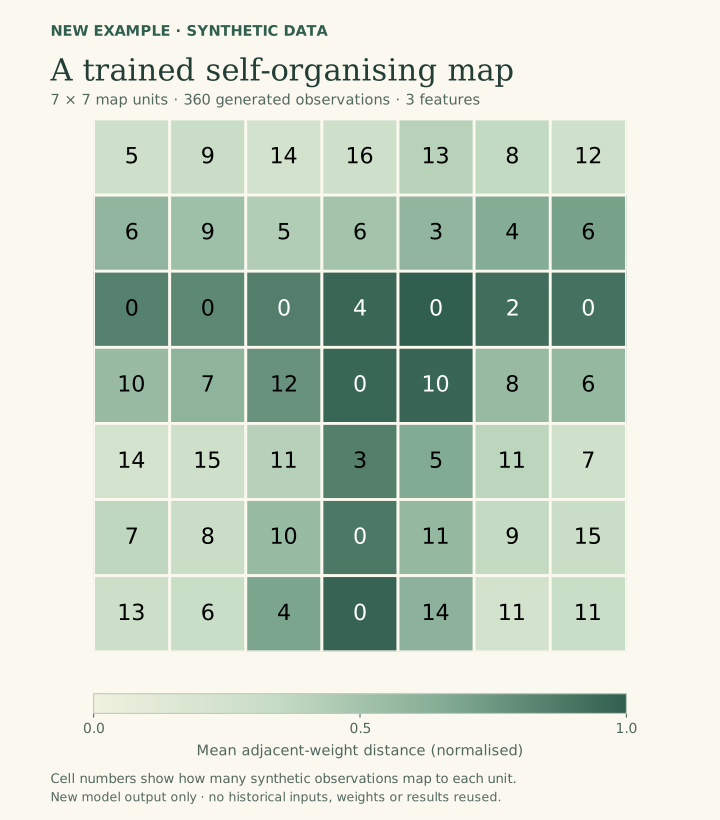
- Self-organising maps to group data using unsupervised machine learning.
Talks & Presentations
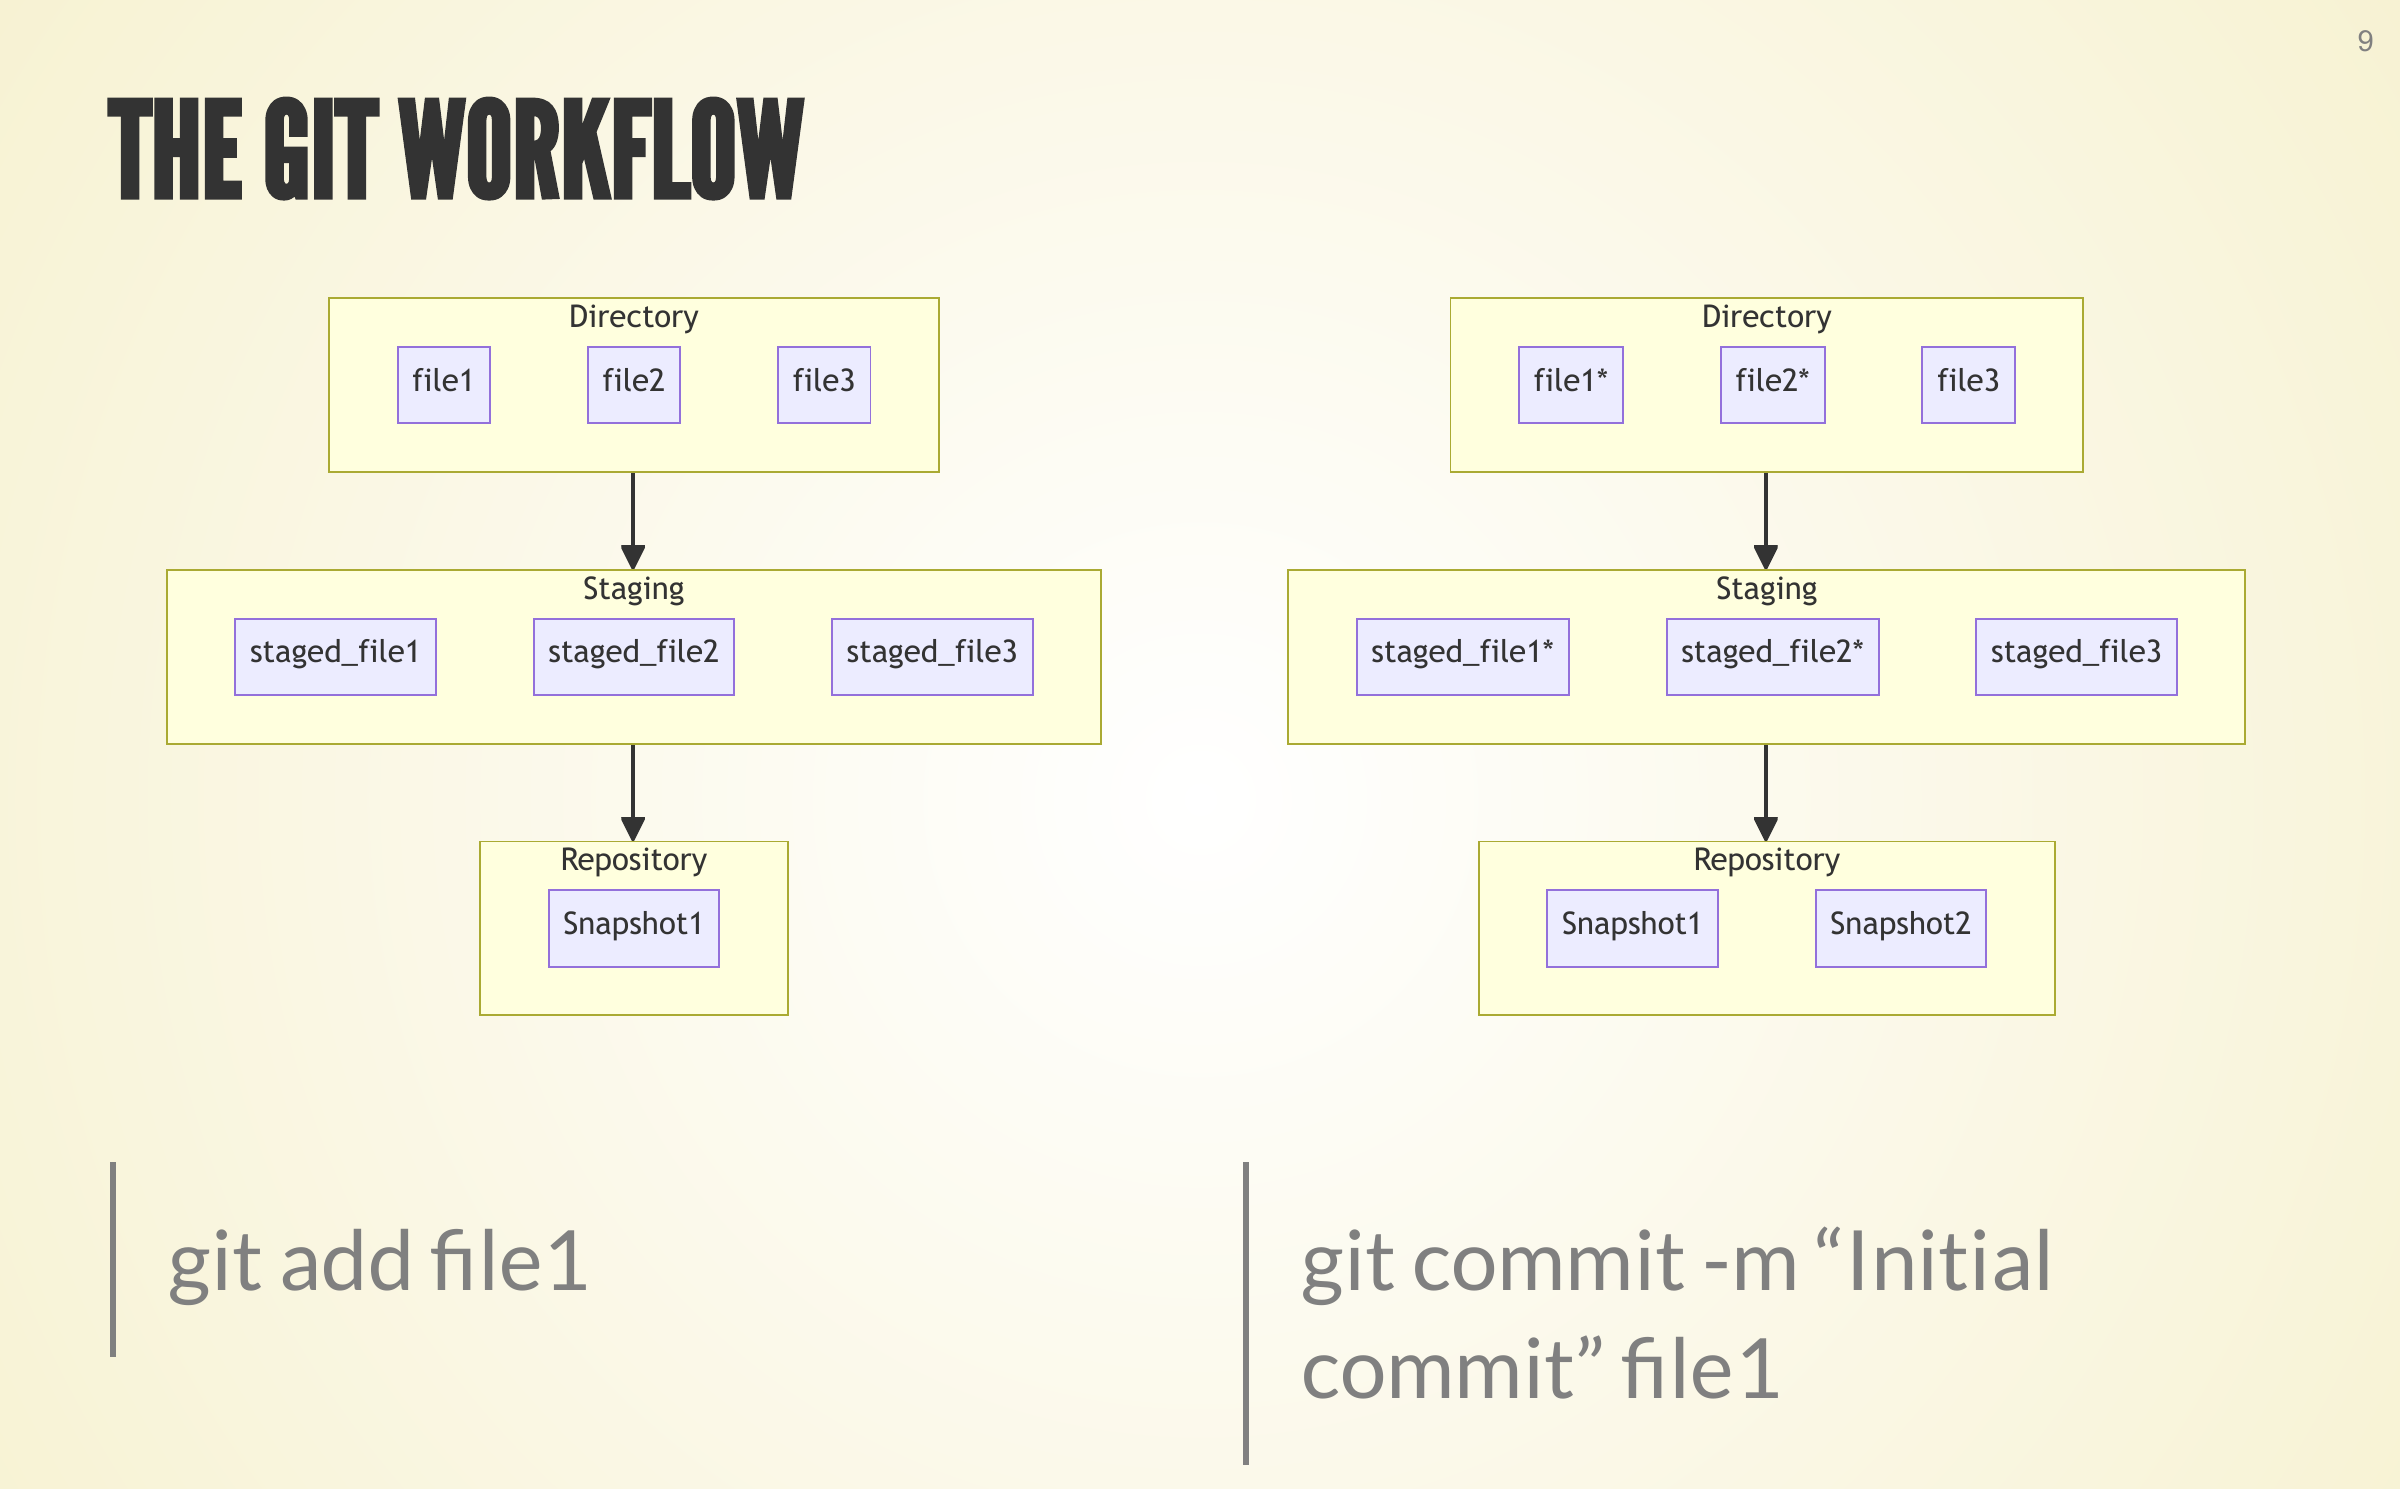
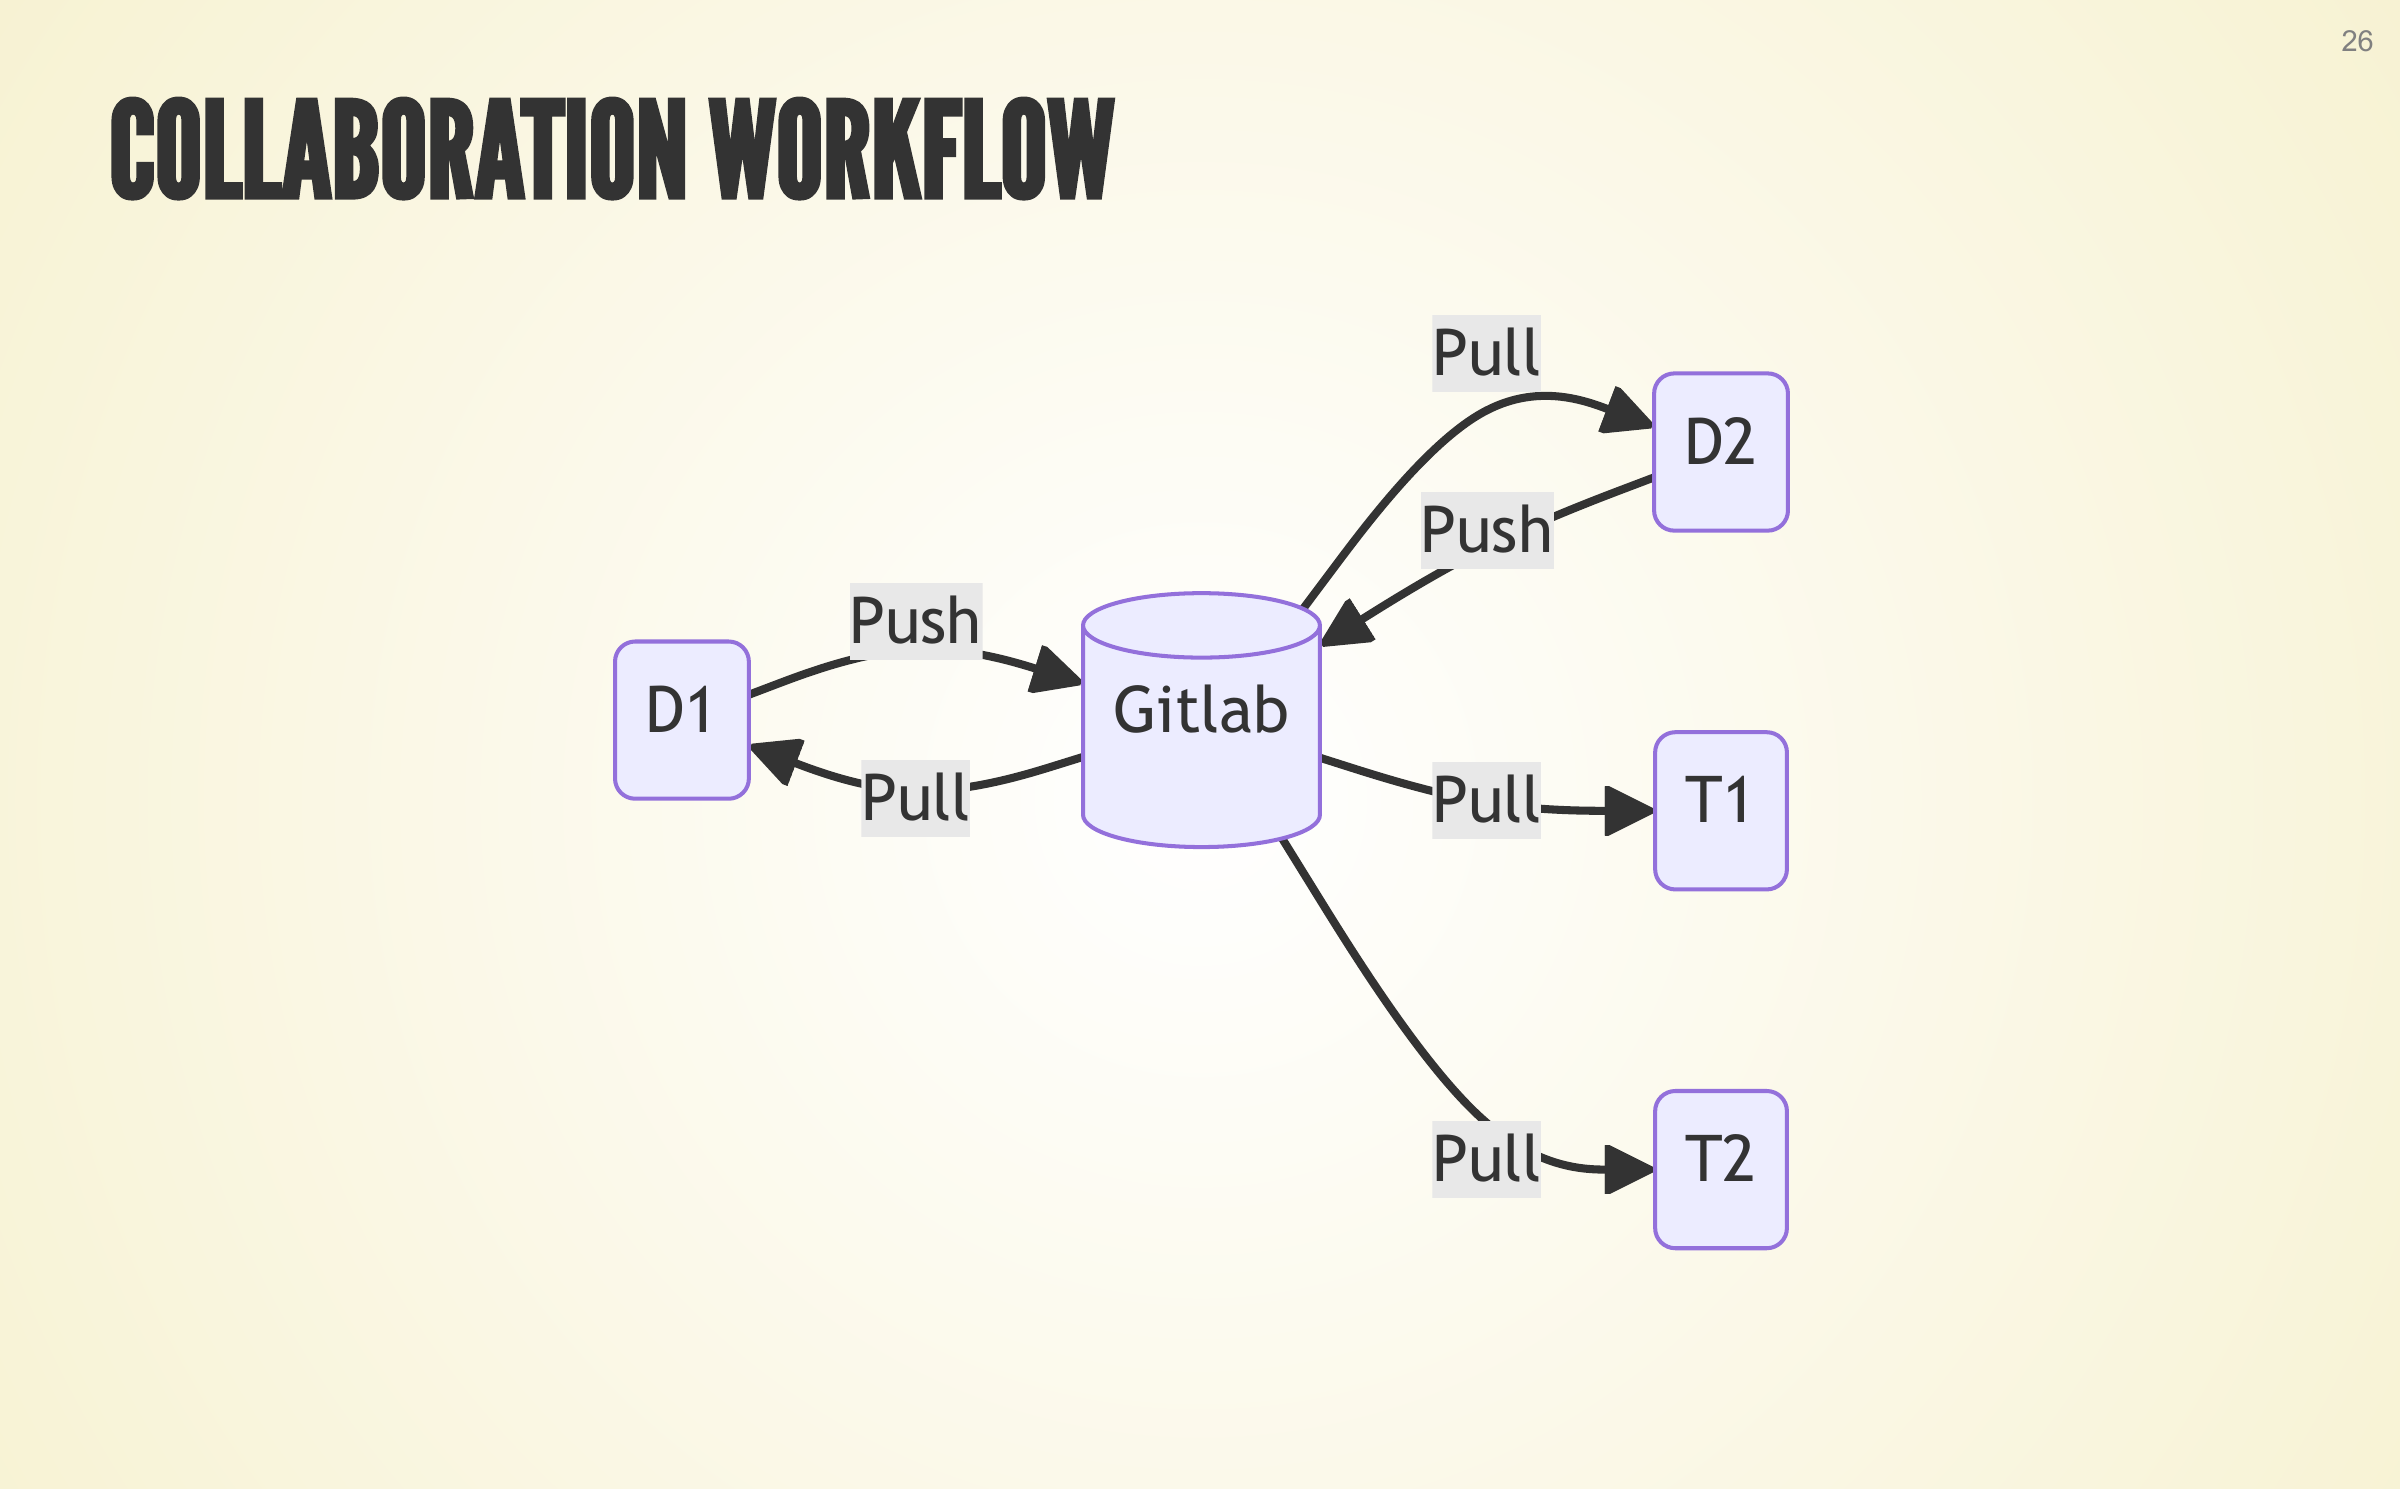
Git workflow presentation
As part of setting up the infrastructure for the migration project, I set up the Git version control system. Based on my experience setting it up, I was asked to provide a presentation to two internal communities.
My work ethic
- I am a public servant and I take my job seriously and care about the quality of my work, and I also like to have fun along the way.
- I ask for help when needed and am happy to provide help to my colleagues. I do not like to keep hard boundaries between my colleagues’ and my work.
- I value not making assumptions and keeping an open mind to others’ opinions and ideas.
- I enjoy the work that I do and am dedicated to doing the best I can.