Data Science Programmer · Migration testing
Check values and compare the patterns
I used explicit checks alongside visual comparisons to investigate where the migrated calculations agreed and where they needed more work.
Selected historical code · Generic placeholders · No original data or saved outputs
Compare the outputs, refine the implementation
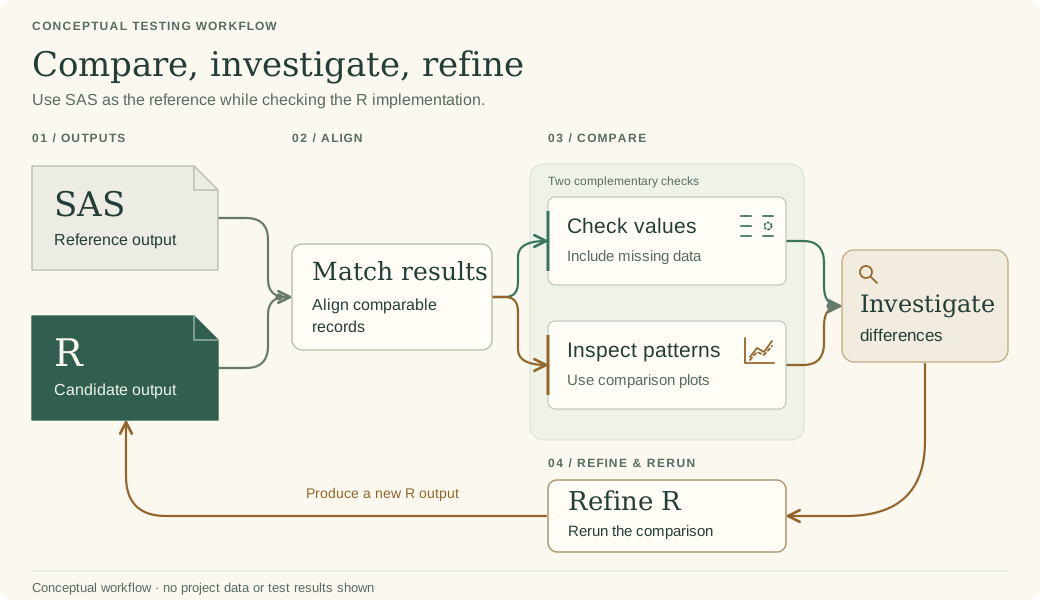
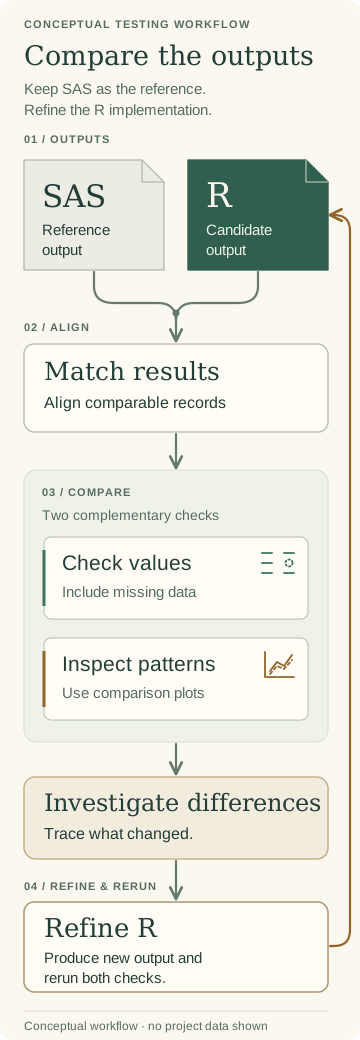
SAS and R outputs feed matching checks. Values, missing data and visual patterns help identify differences to investigate before refining R and rerunning the checks.
01 / APPROACH
Make the comparison explicit
This comparison joins records by shared keys and checks values and missingness.
R · adapted excerpt
comparison <- reference %>%
  left_join(candidate, by = join_by(record_id, measure),
            suffix = c("_reference", "_candidate"))

comparison <- comparison %>%
  mutate(matches = if_else(value_reference == value_candidate,
                           TRUE, FALSE)) %>%
  mutate(matches = if_else(is.na(value_reference) &
                           is.na(value_candidate), TRUE, matches)) %>%
  mutate(matches = if_else(is.na(value_reference) &
                           !is.na(value_candidate), FALSE, matches)) %>%
  mutate(matches = if_else(!is.na(value_reference) &
                           is.na(value_candidate), FALSE, matches))

all(comparison$matches)
Generic keys and value names replace the originals. Input preparation is omitted; this is one comparison, not the complete test suite.
02 / APPROACH
Look for differences in shape
Grouped boxplots and separate panels provide another way to compare sources and investigate differences.
R · adapted excerpt
ggplot(comparison_values, aes(x = factor(group), y = value)) +
  geom_boxplot(aes(fill = group), show.legend = FALSE) +
  facet_wrap(vars(source)) +
  theme_light()
group, value and source are generic labels. The original data, plot limits and surrounding styling are omitted.