Data Science Programmer · SOM study
Learning with a self-organising map
I explored how self-organising maps arrange multi-dimensional observations on a two-dimensional grid. This small example connects the preparation and training code to the map it produces.
Synthetic inputs · Newly trained example · No historical data or model outputs
01 / PREPARE
Put the features on a common scale
Generate three hypothetical groups, then rescale each feature between zero and one. The group labels are not passed to the model.
Python · code used for this example
import numpy as np

rng = np.random.default_rng(241108)
centres = np.array([
    [-2.0, -1.0, 0.5],
    [0.0, 2.0, -1.0],
    [2.0, -0.5, 1.5],
])
samples = np.vstack([
    rng.normal(centre, 0.35, size=(120, 3))
    for centre in centres
])
features = (
    (samples - samples.min(axis=0))
    / np.ptp(samples, axis=0)
)
NumPy supplies the synthetic samples and featurewise min-max scaling. This follows the same preparation idea as my learning study, using new inputs.
02 / TRAIN & INSPECT
Train the grid and inspect its structure
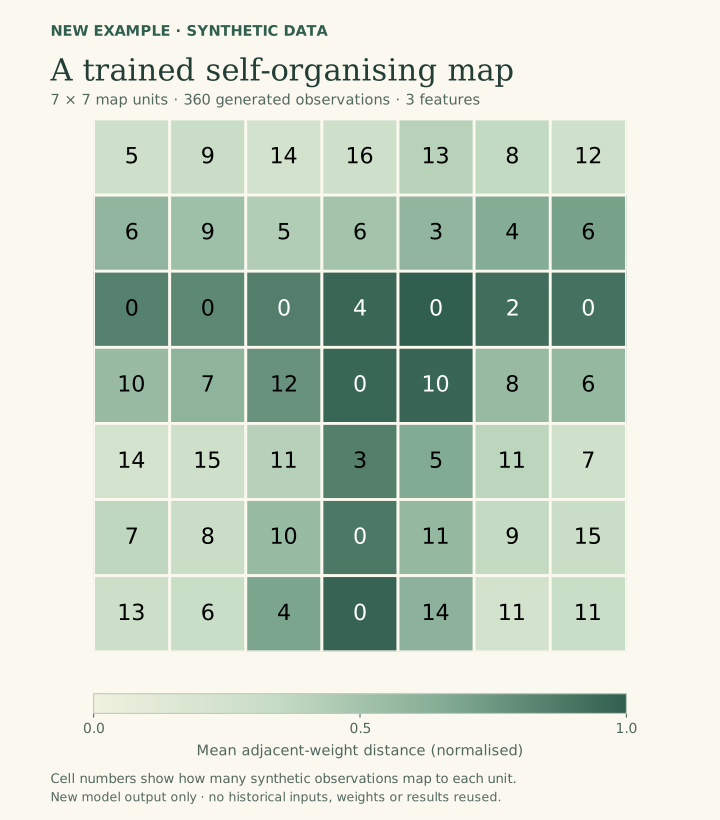
MiniSom updates neighbouring map units during training. The same trained weights produce the distance colours and assignment counts shown below.
Python · code used for this example
from minisom import MiniSom

som = MiniSom(
    x=7, y=7, input_len=features.shape[1],
    sigma=1.2, learning_rate=0.5, random_seed=17,
)
som.random_weights_init(features)
som.train_random(features, num_iteration=4000)

neighbour_distance = som.distance_map(scaling="mean").T
assigned_samples = som.activation_response(features).T
Seeds and model settings are illustrative choices for this new example. The distance colours and counts come from this trained model.
03 / READ THE RESULT
The map produced by this code
Colour shows local differences
Darker cells indicate a larger mean Euclidean distance between that unit’s learned feature vector and those of its adjacent units. Values are divided by the largest mean distance in this map.
Numbers show assignments
Each number counts the synthetic observations whose nearest map unit is that cell. The counts total 360.