Responsibilities
I was responsible for collecting the Measures of Support data, which quantify government support to the agriculture sector.
I was also responsible for looking at ways to increase the efficiency of our data collection, processing and dissemination procedures.
Collect, prepare, explore, share
Improve the preparation. Make more room for exploration.
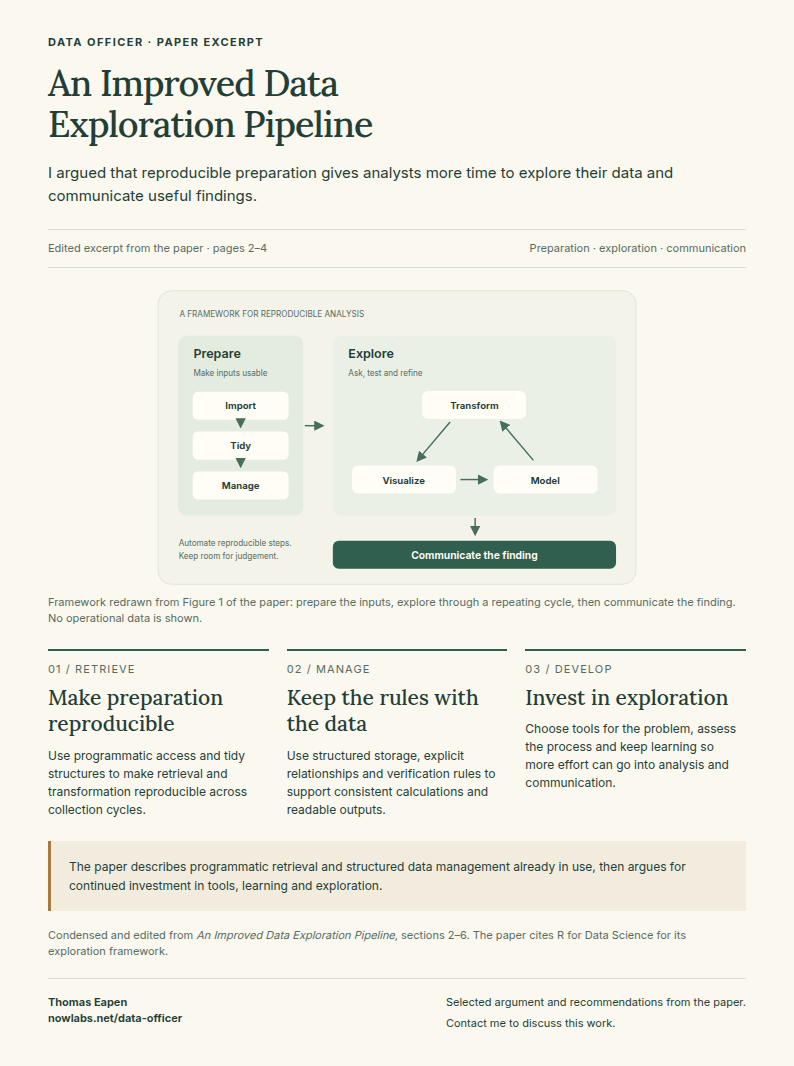
A view of the framework described in the paper An Improved Data Exploration Pipeline.
Programming
I wrote over 100,000 lines of R and Python code.
The lines of code do not indicate quality; however, they do indicate a lot of work in R and Python programming.
R accounted for most of my programming work. The Python examples further down are a small selection.


R Programming
R Programming Experience
- Data manipulation with the Tidyverse ecosystem.
- Geospatial mapping.
- Plotting and charting; stylised Excel outputs.
- Dashboards and hierarchical tree output generation.
- Database manipulation.
- Metaprogramming.
- REST/JSON data imports.
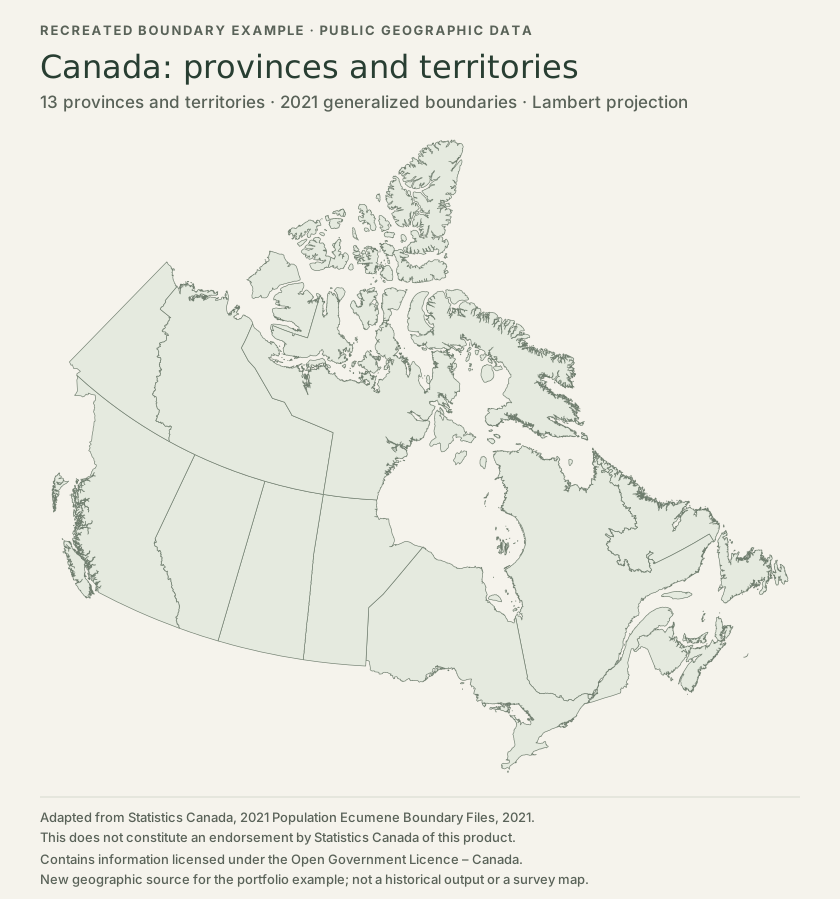
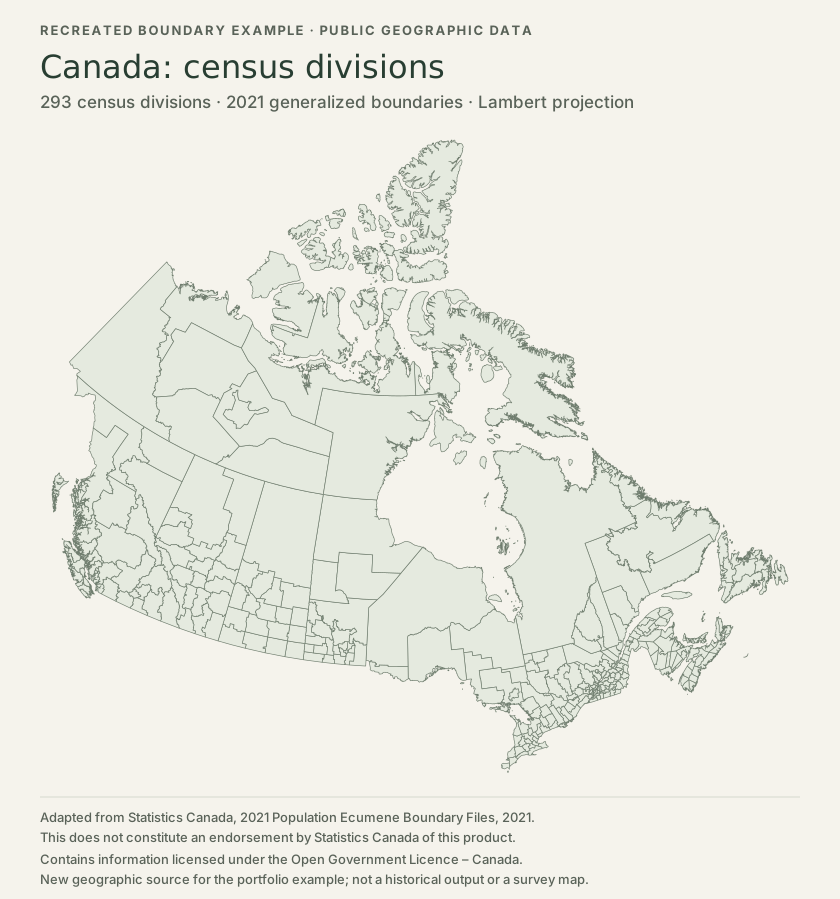
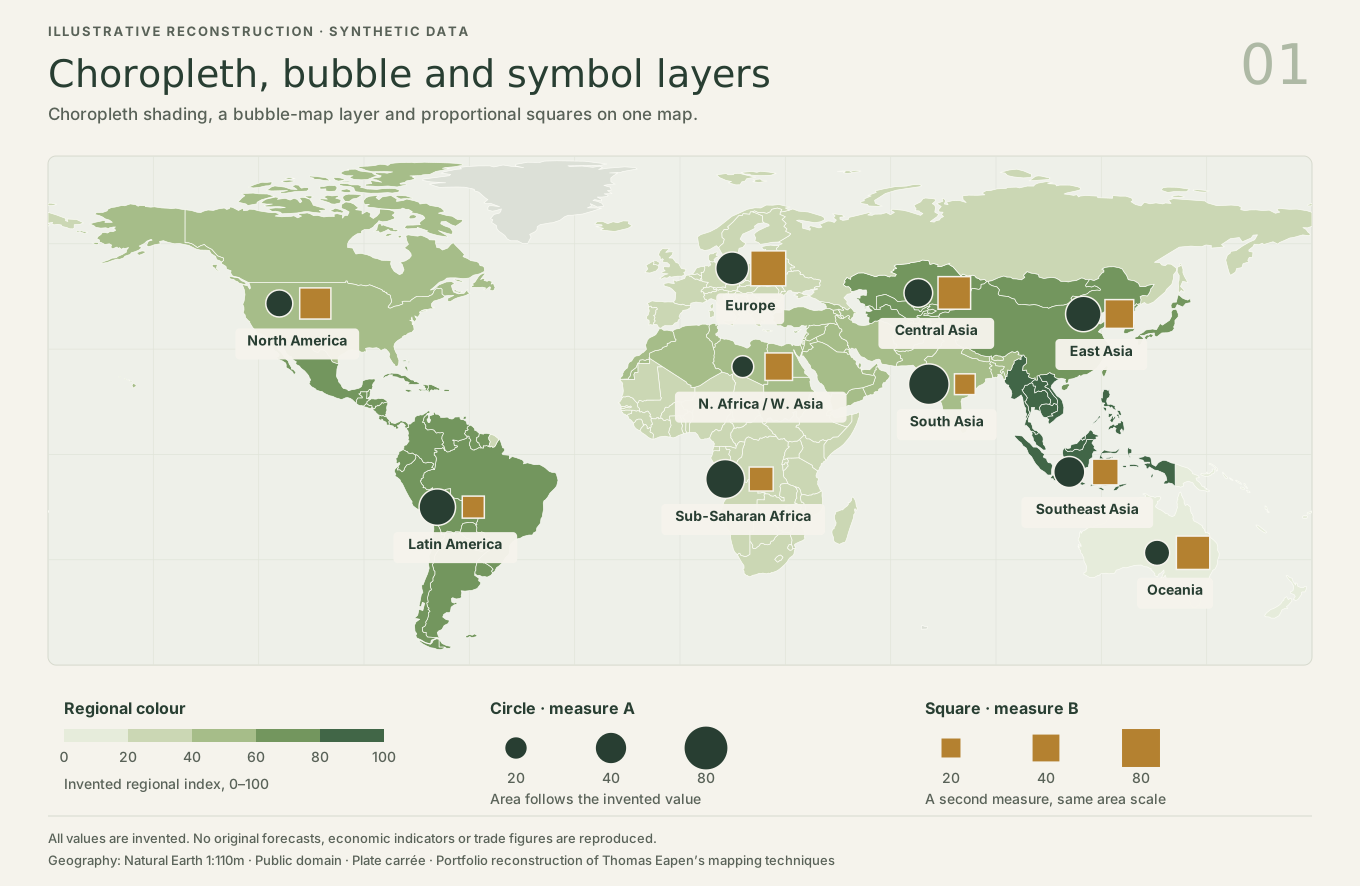
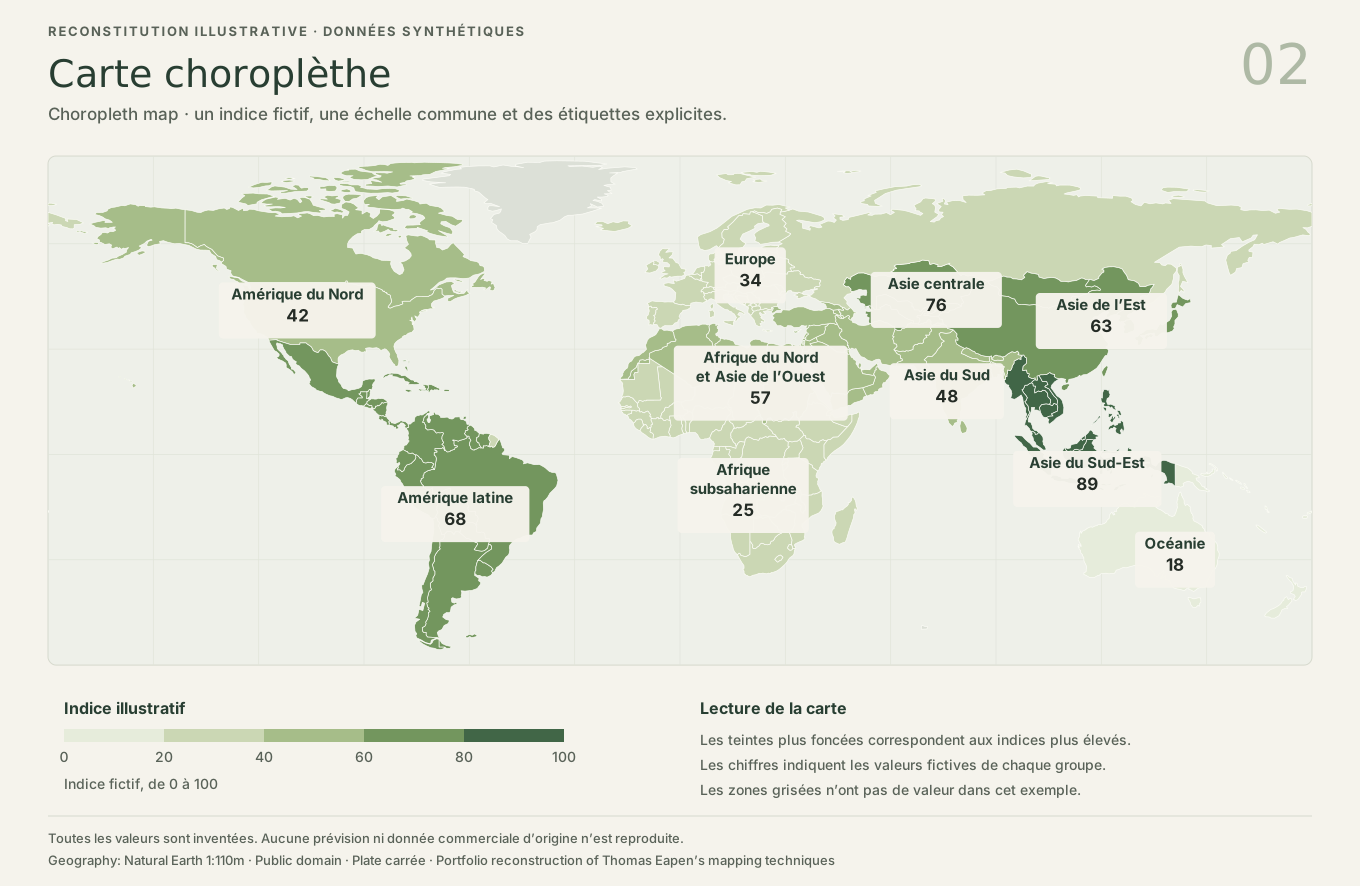
Data manipulation and geospatial mapping
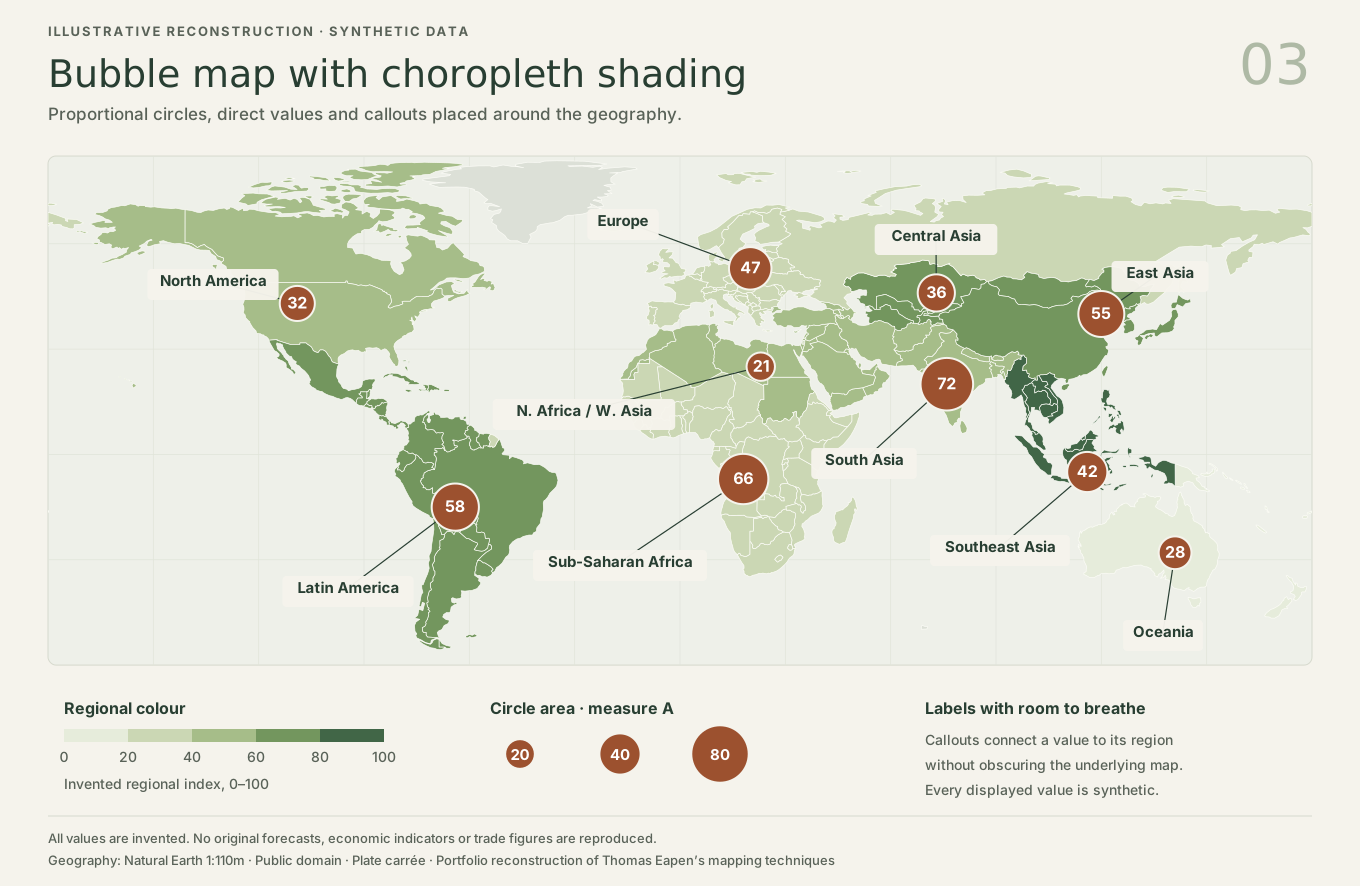
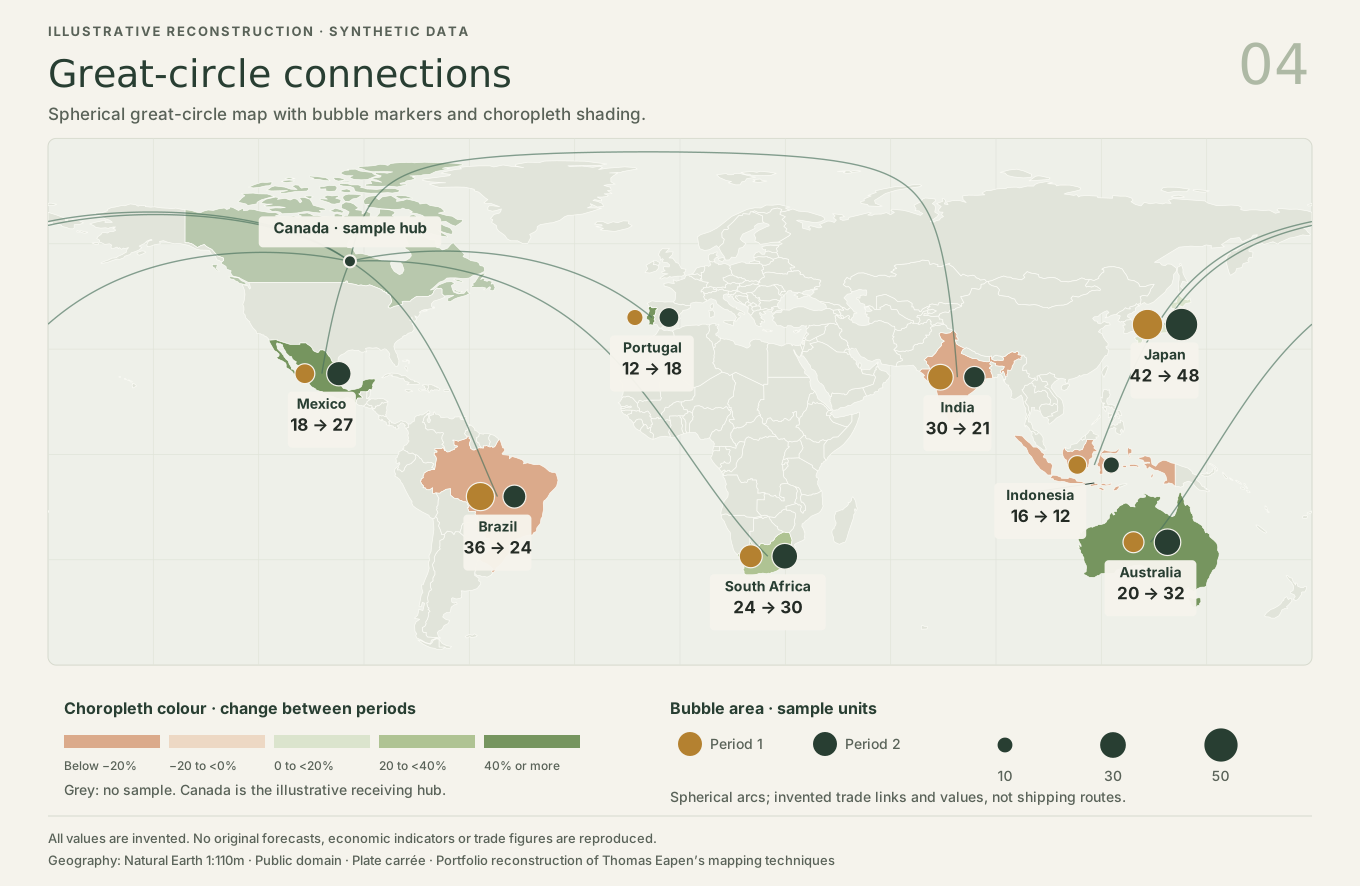
We used R geospatial libraries and Adobe Photoshop to layer maps with graphics.
The Canada examples show provincial, territorial and census-division boundaries using openly licensed Statistics Canada geometry. Four illustrative world maps demonstrate choropleth, bubble and great-circle mapping with synthetic data.
- Choropleth / thematic maps.
- Bubble maps.
- Great-circle maps.
Publication Design
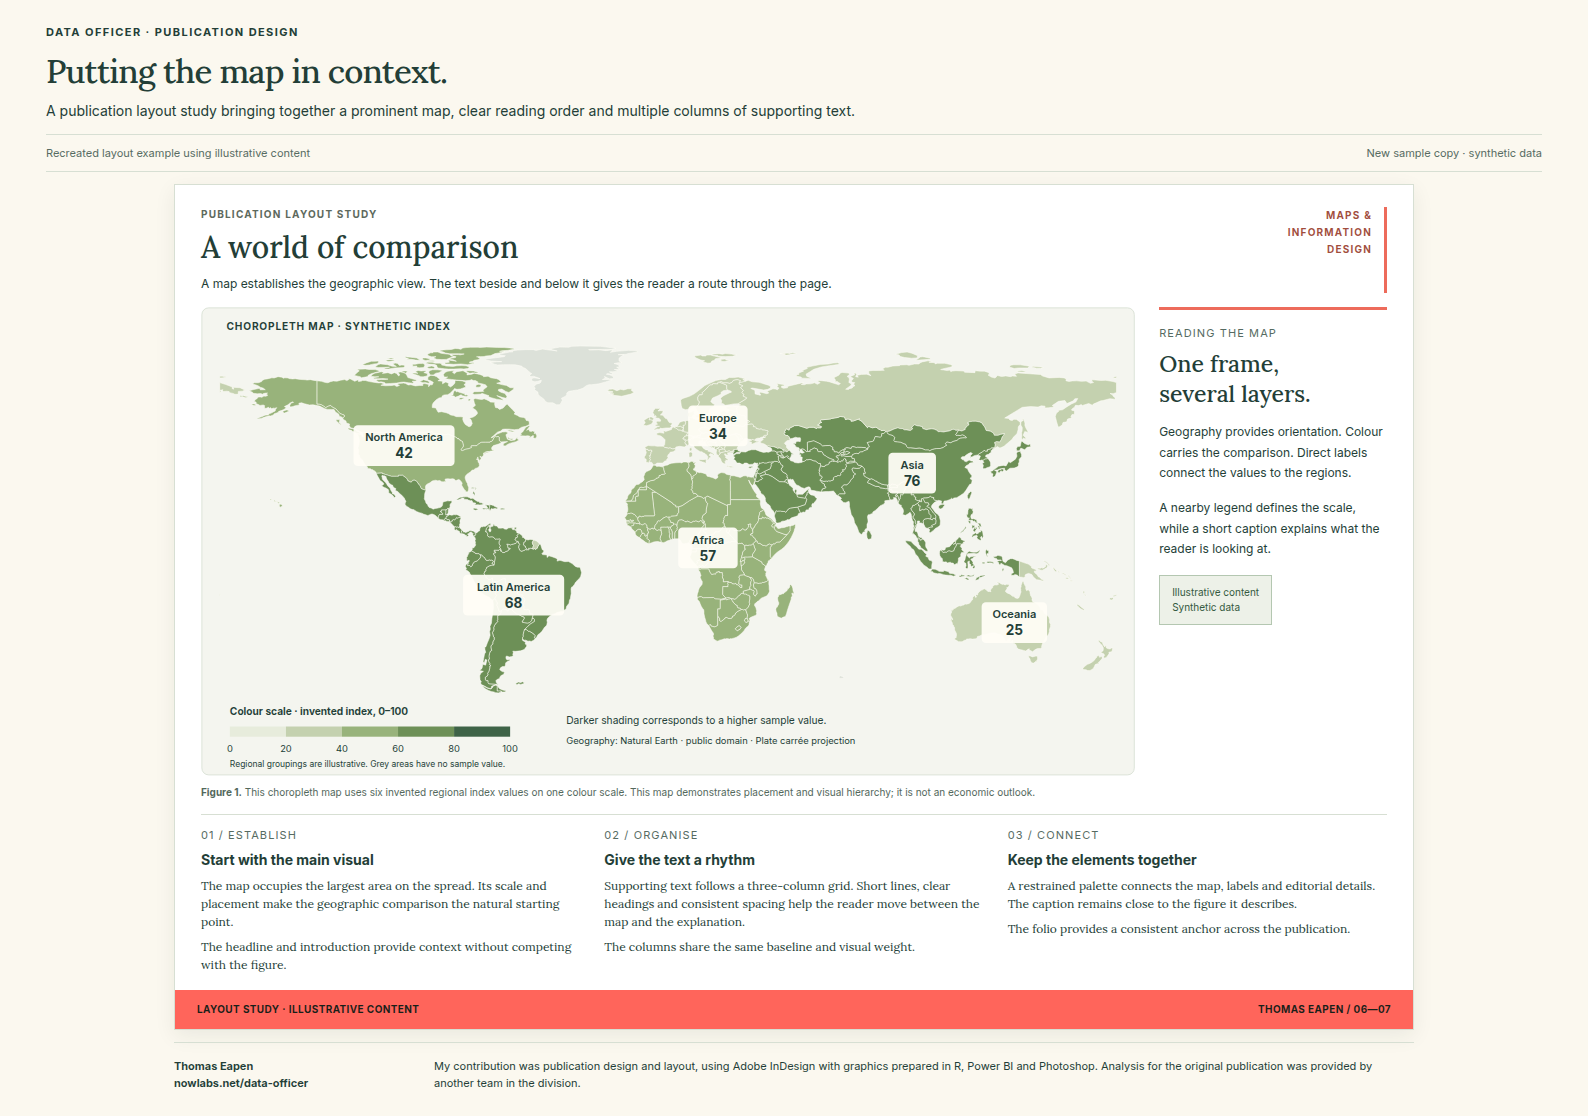
I designed and laid out a departmental outlook publication in Adobe InDesign, and used R, Power BI and Adobe Photoshop for its maps and charts. The analysis was provided by another team in the division.
Flexdashboard Example
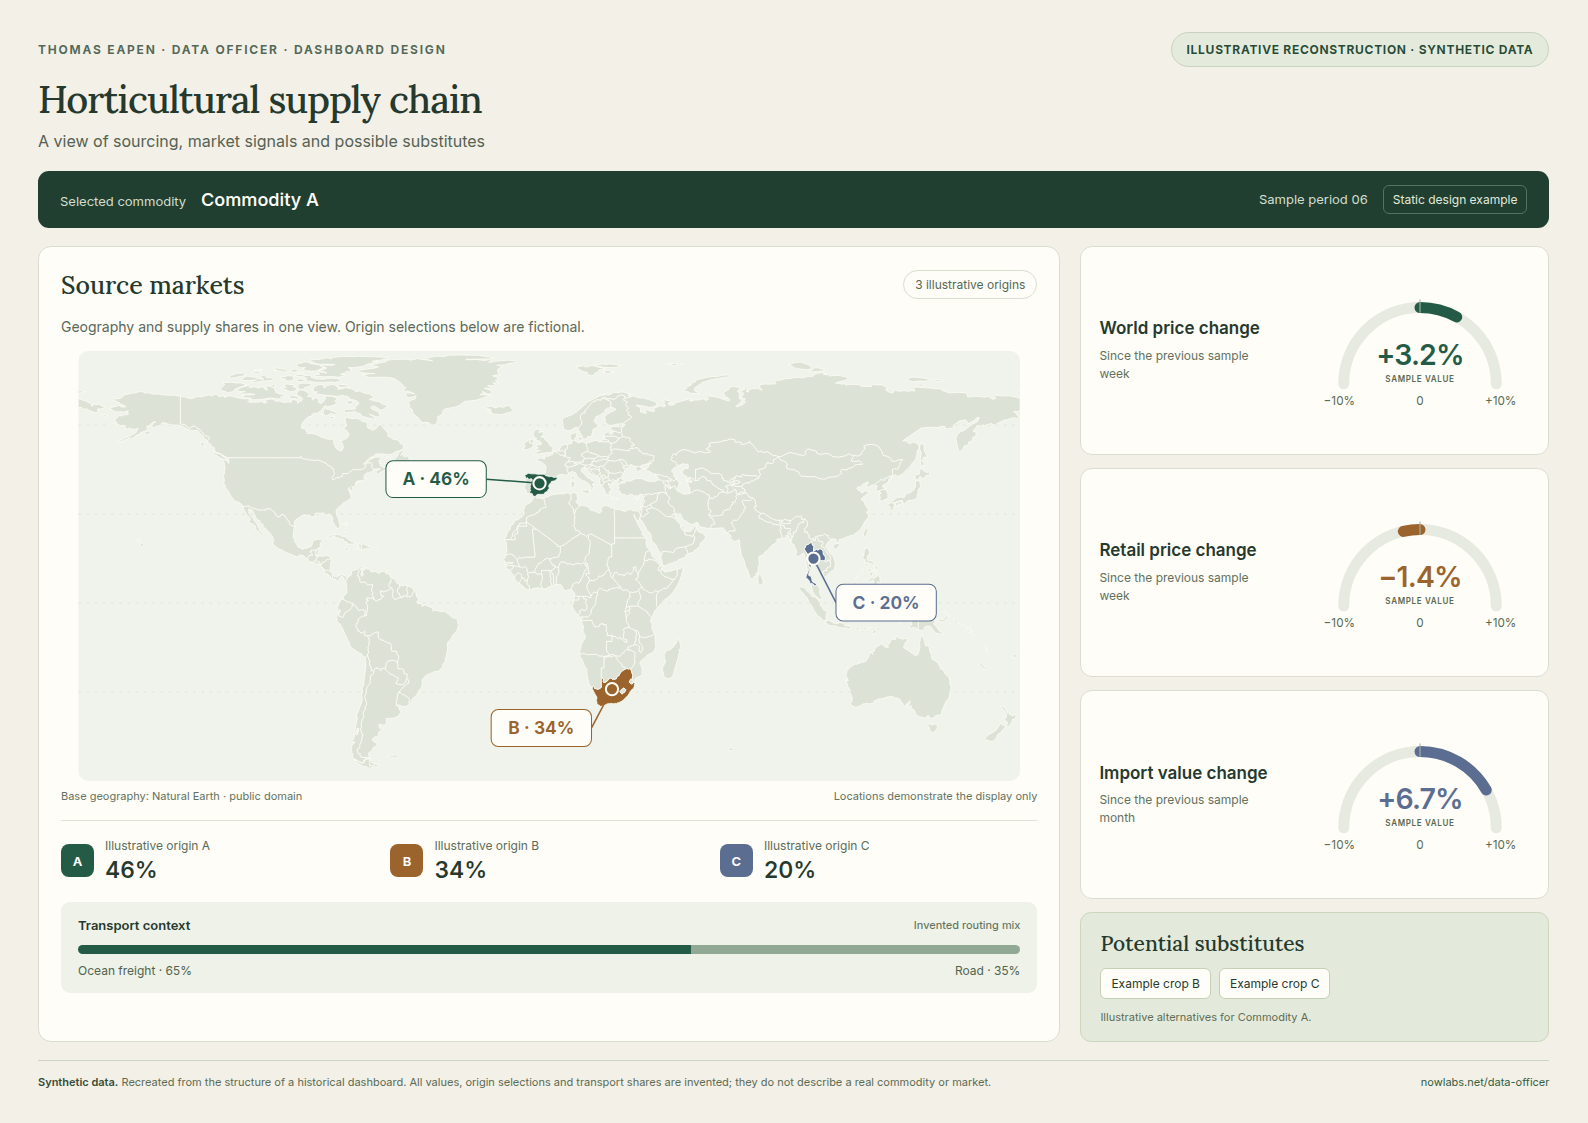
This dashboard was created during the COVID lockdown, when up-to-date information on supply-chain variability was needed. The example below recreates its layout and visual elements using invented data.
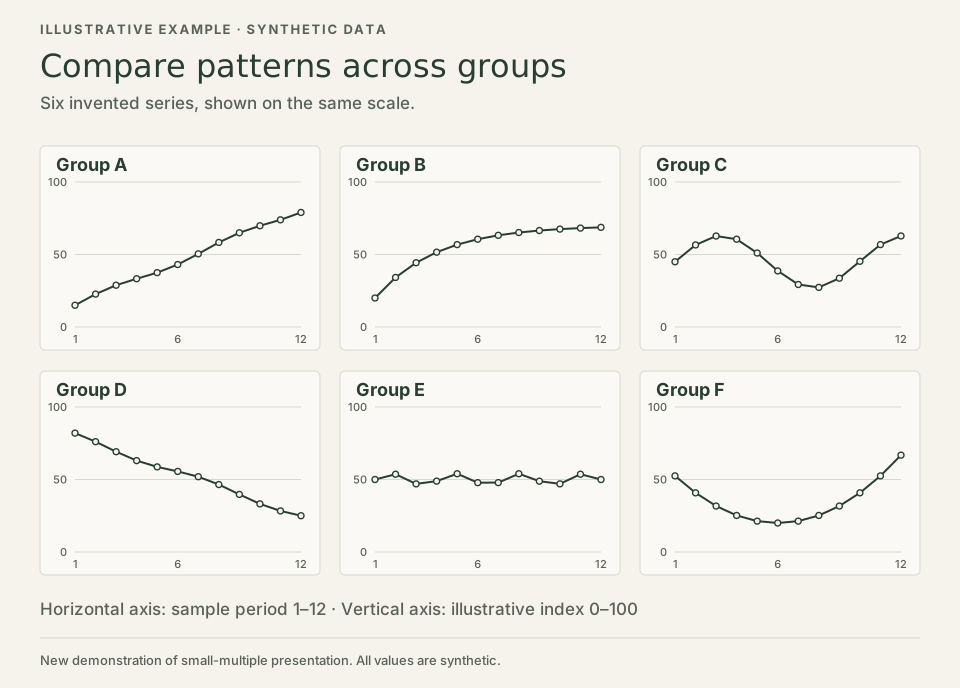
Trellis plots
Small-multiple plots make it easier to compare patterns across groups. This illustration uses synthetic series to show the approach without publishing the original provincial figures.
R Metaprogramming
I used metaprogramming to combine R formulas with Excel sheets, which made the calculations transparent to colleagues who do not use R. See my talk, Metaprogramming with R.
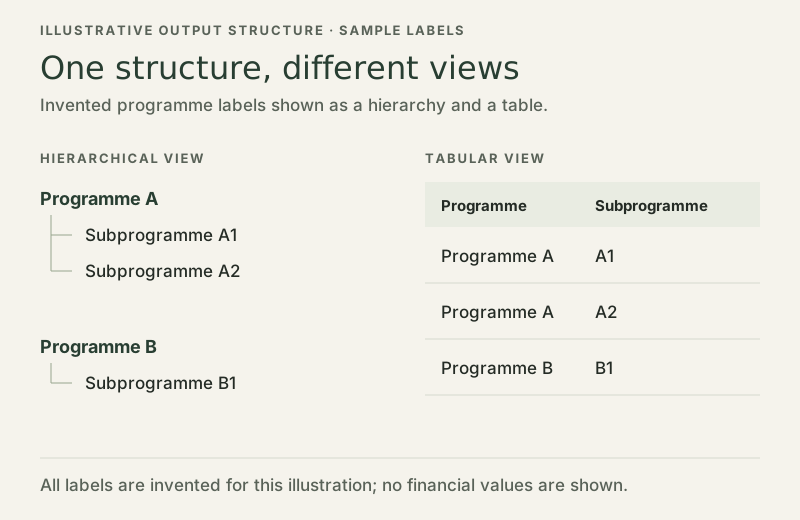
Automatic generation of hierarchical outputs
I used R libraries to generate stylised hierarchical outputs for different stakeholders automatically from our data sources.
R code for the WTO database application
My R code for the World Trade Organization (WTO) database application included functional programming and metaprogramming.
Python Programming
Python Programming Experience
- Extensive experience with the Pandas data analysis framework.
- Plotting with Matplotlib and Seaborn.
- Data import and processing through APIs.
- Database manipulation through the Django Object Relational Mapper.
- Forecasting.
WTO Database Application
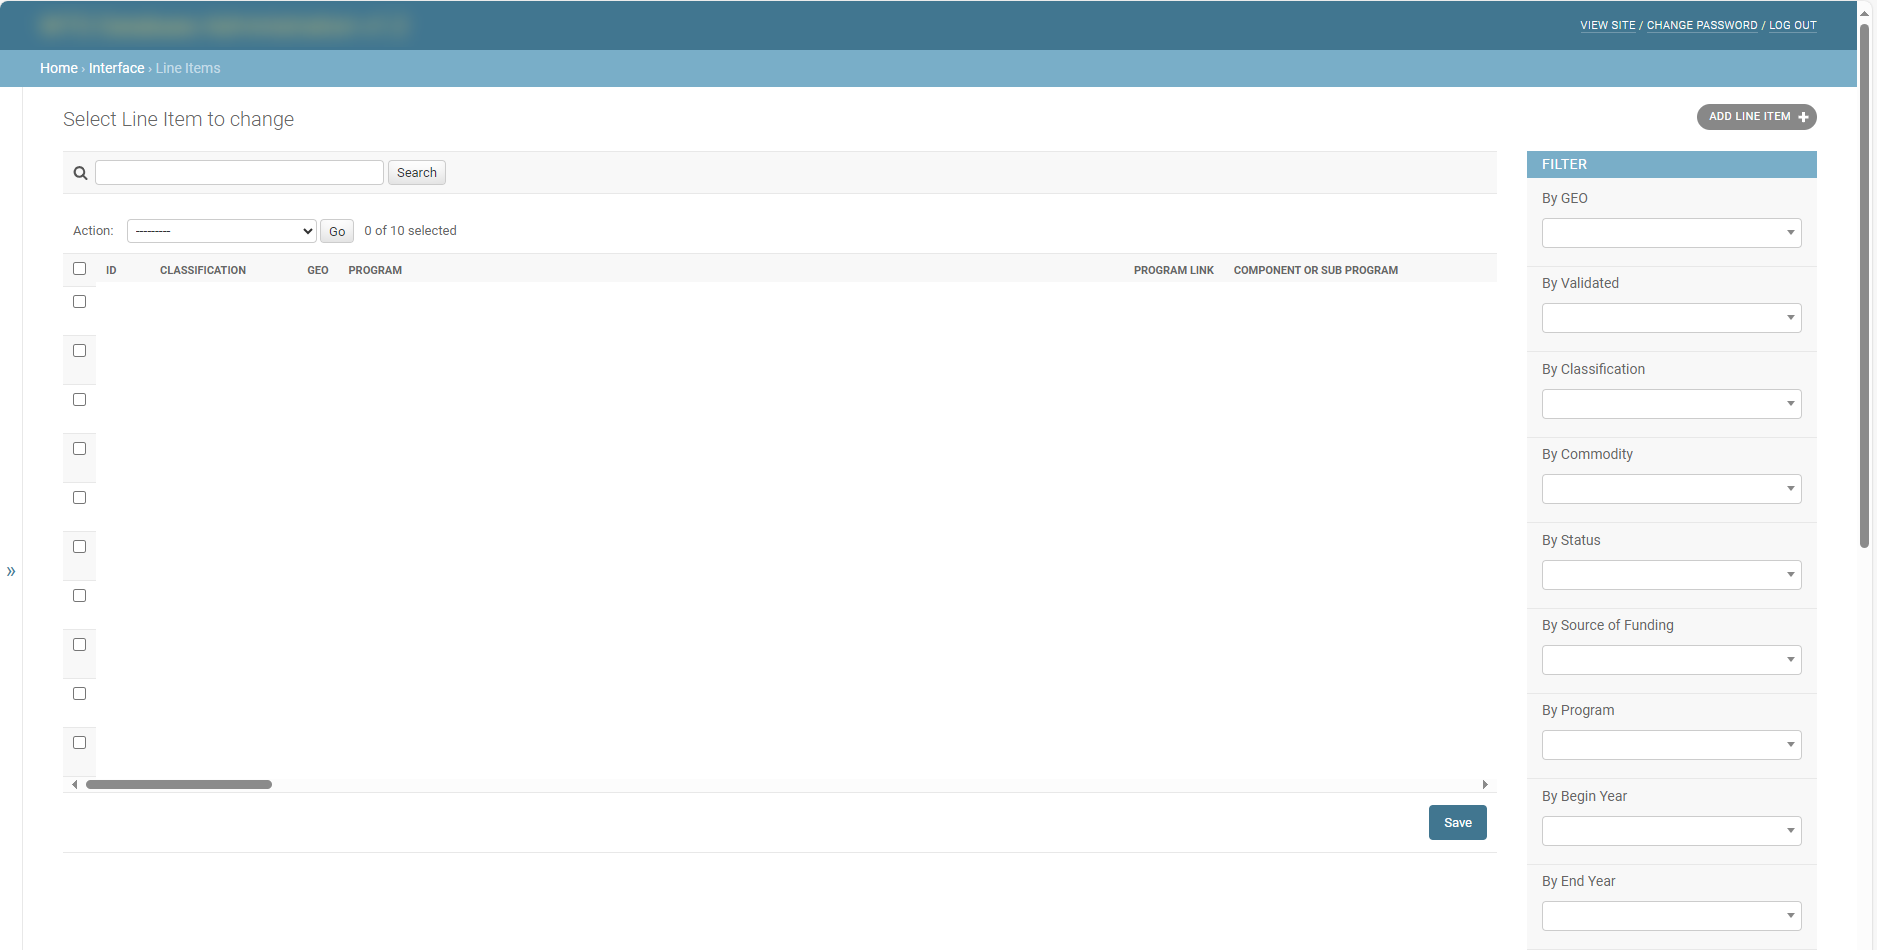
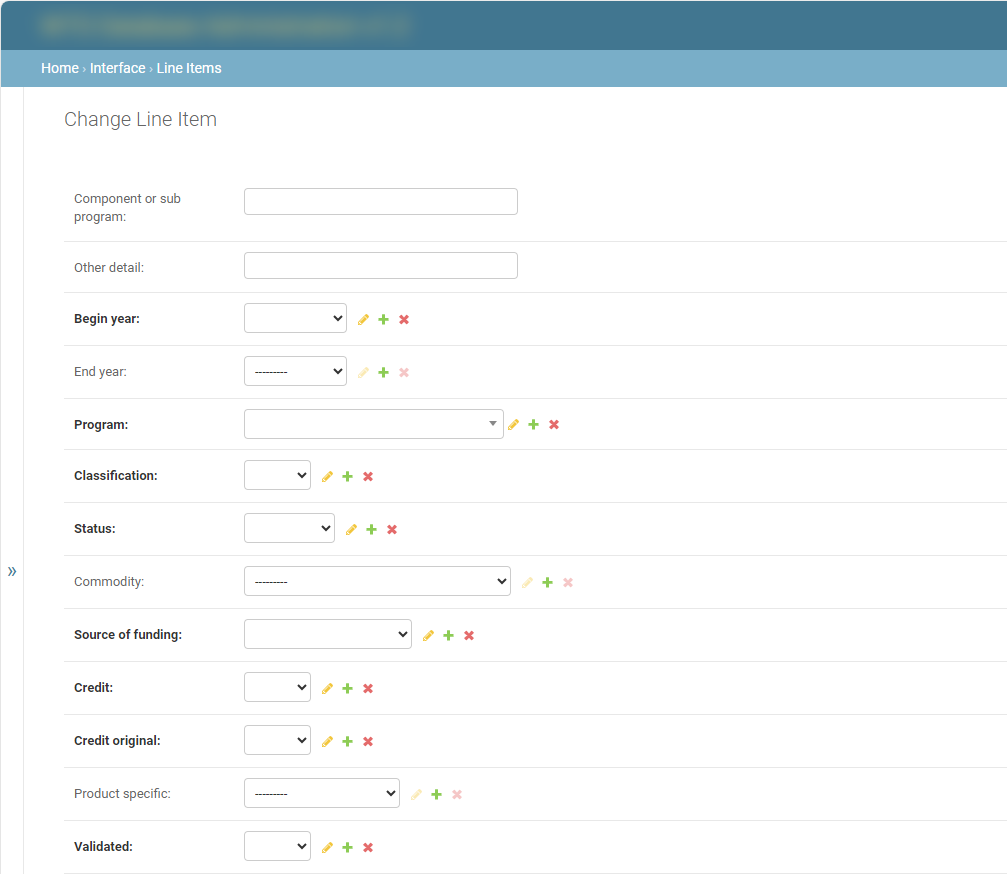
I wrote an application in the Django web framework to manage our WTO database. I used the Django Object Relational Mapper to write Python code that gets translated to SQL to manipulate the data in the database.
I customised the administration interface using the provided hooks to provide a web interface for CRUD (Create, Read, Update and Delete) operations.
I used software engineering processes including documentation, code repositories for versioning and database snapshotting.
Python Programming Showcase
A short selection of code shows how I retrieved data, reshaped it and made its labels easier to understand.
Infographics
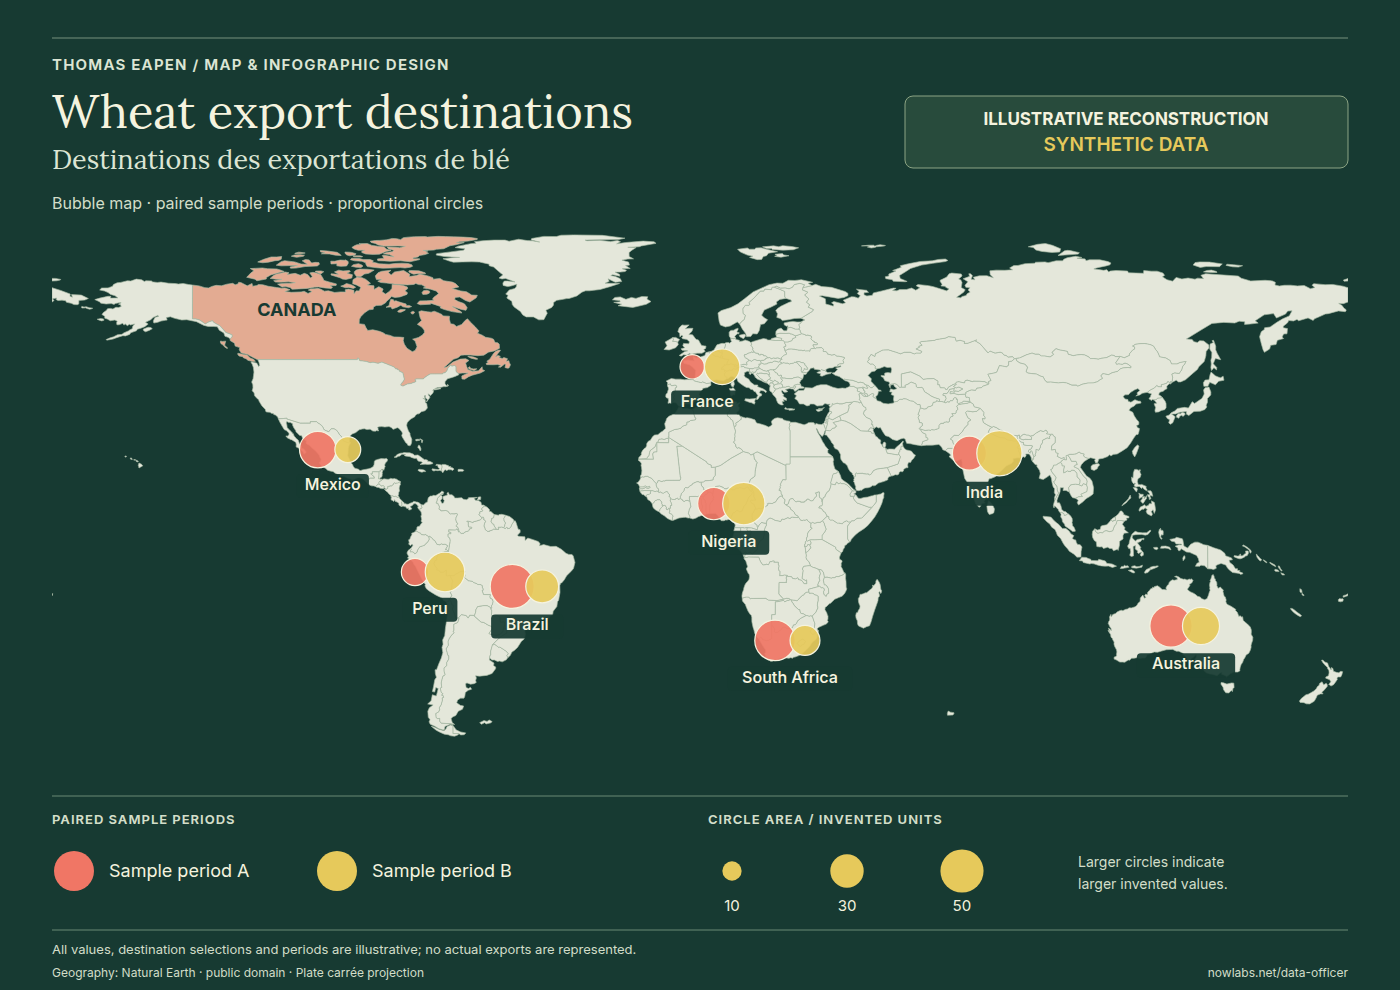
Makeover Exercise — Wheat Export Destinations
As part of the Makeover Exercise run by the Office of the Chief Data Officer, I made three submissions, which were highly rated. I was named the “Tool Wiz Champion” of 2021 and received a Certificate of Recognition for my contribution. I was also invited to the “Show and Tell” to present how the Wheat Export Destinations graphic was designed and built.
This graphic was created in multiple layers. The geospatial layer was built in Python with the Pandas and GeoPandas libraries. Adobe InDesign was used to add design elements to bring some flair to the graphic.
The example below recreates the design using synthetic data.
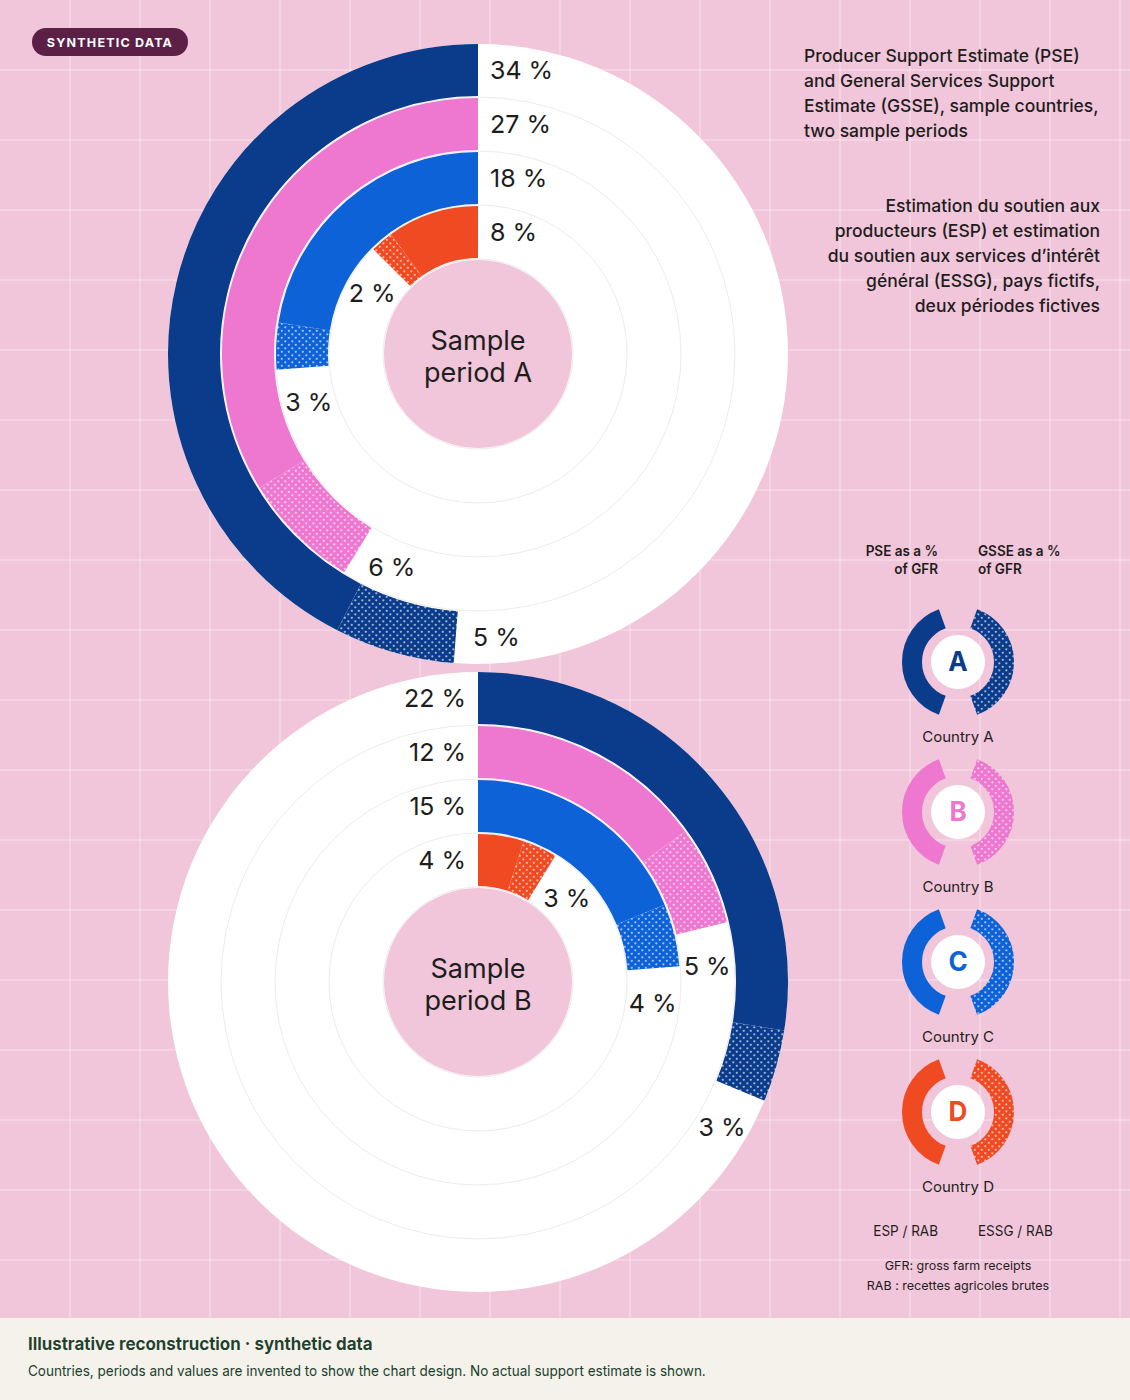
Makeover Exercise — PSE / GSSE Trends
This graphic was created using Adobe Illustrator. I learnt how to use Illustrator from a course on Udemy.
The original compared the Producer Support Estimate (PSE) and General Services Support Estimate (GSSE) of selected countries over two periods, using publicly available OECD data. The example below recreates the design using synthetic data.
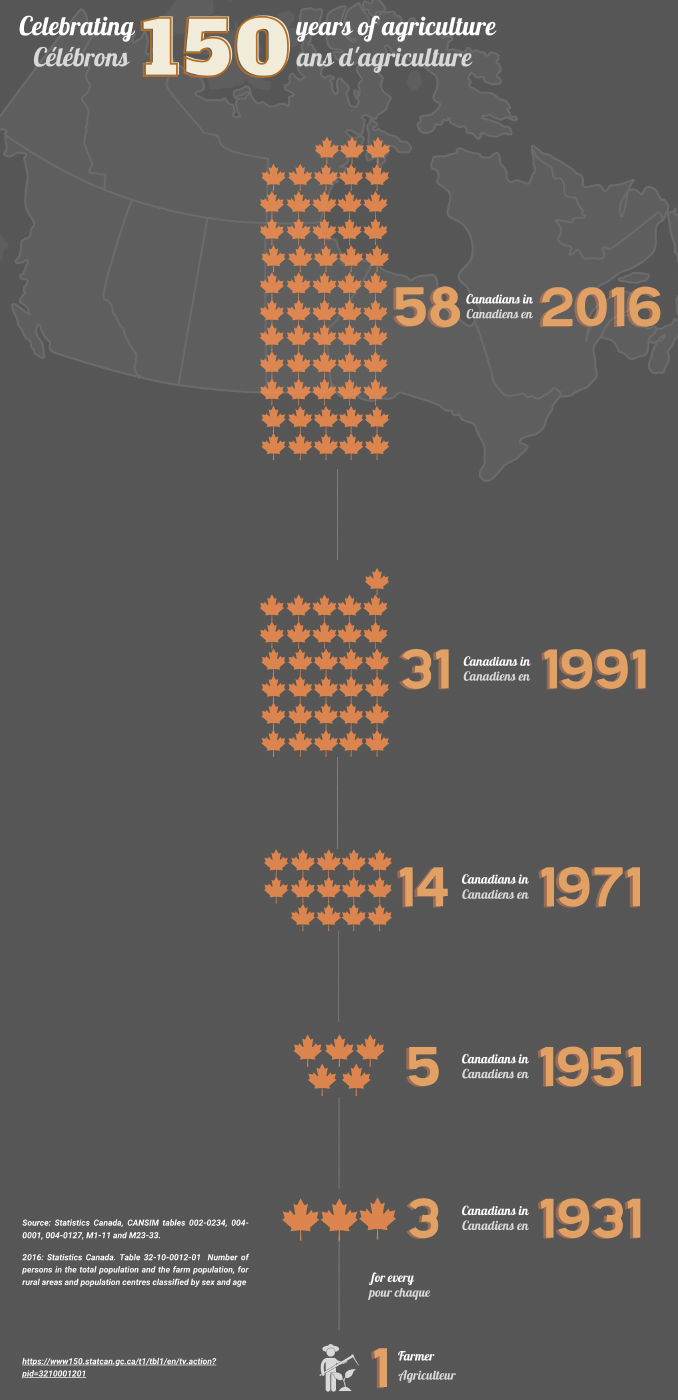
Makeover Exercise — Celebrating 150 Years of Agriculture
This graphic was created using Canva.
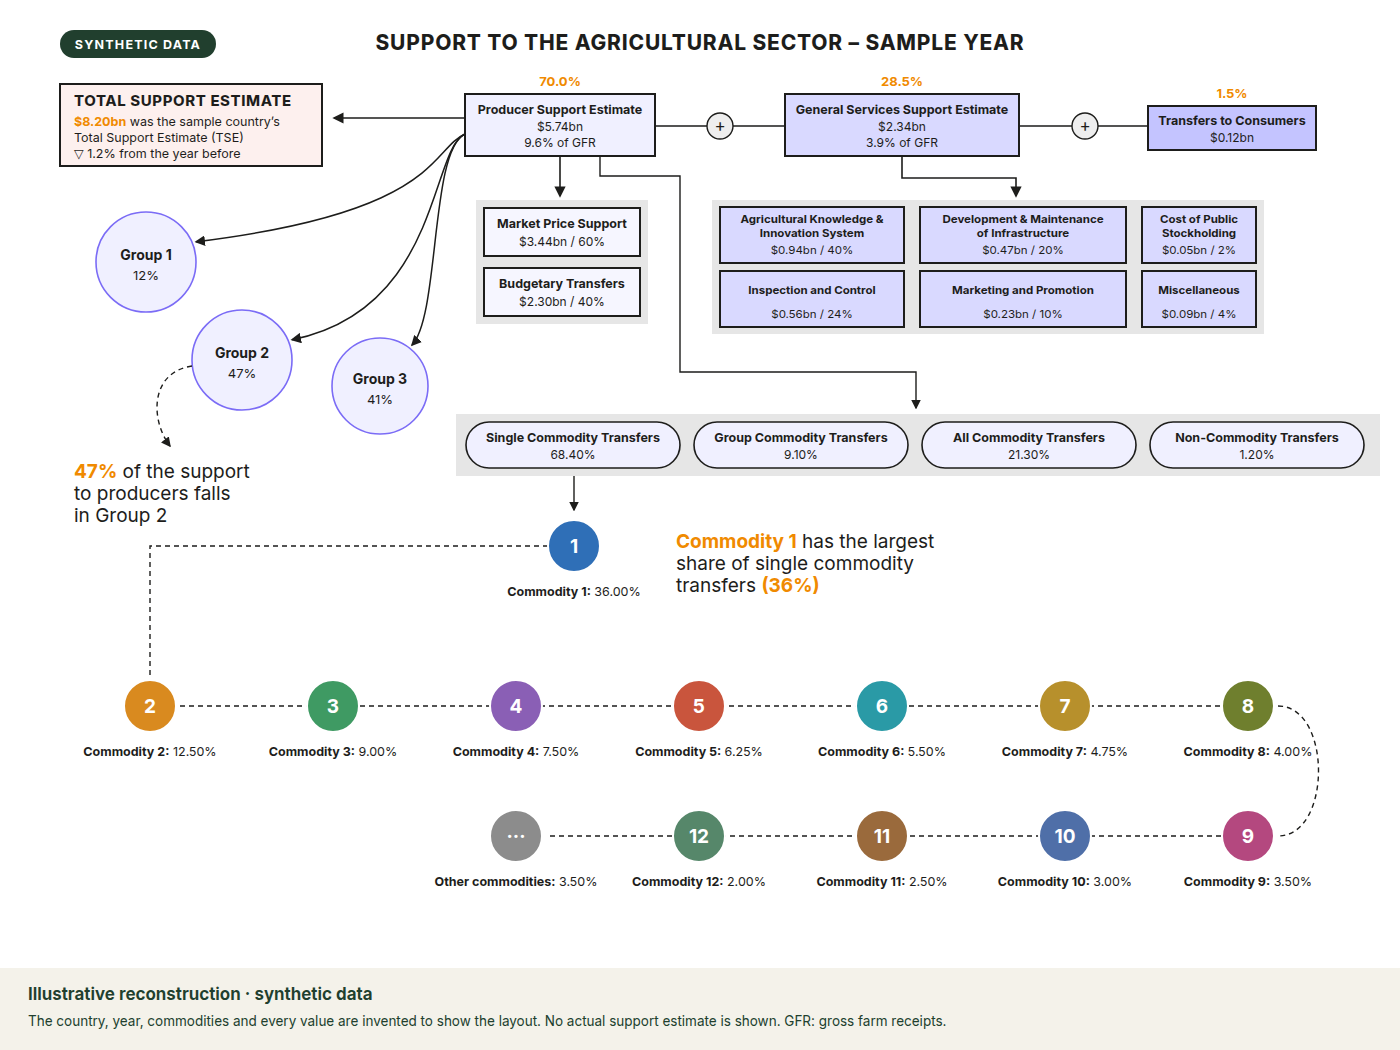
Miscellaneous Graphics — Canadian Agricultural Support, 2018
This graphic was created using the LaTeX typesetting system.
The original set out Canada’s agricultural support in 2018, using publicly available OECD data. The example below recreates the layout using synthetic data.
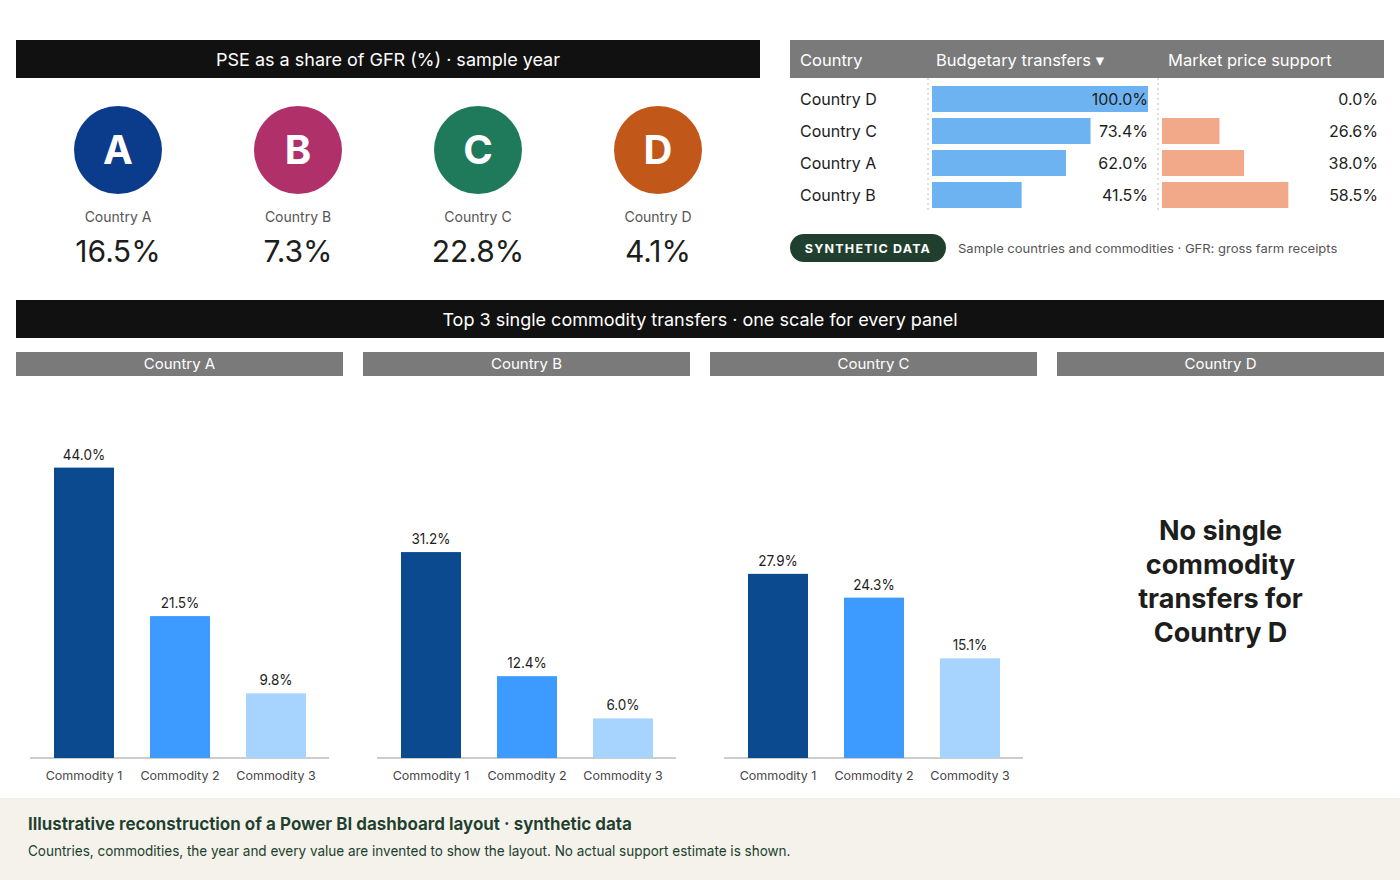
Miscellaneous Graphics — PSE as a share of Gross Farm Receipts
This graphic was created using Power BI.
The original compared countries using publicly available OECD data. The example below recreates its layout using synthetic data.
Choosing tools for the job
In the projects I work on, I am tool-agnostic. Rather than working only with the tools I know, I investigate the best tool for the job, learn it and begin using it.
Talks
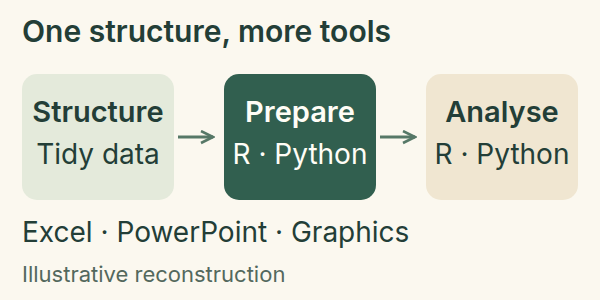
An Improved Data Pipeline
I presented improvements we had made to our data pipeline, explaining how a common data structure supported reproducible preparation, analysis and communication across a wider range of tools.
Makeover Exercise — Show and Tell
I was invited by the Office of the Chief Data Officer to give a presentation on the building of the Wheat Export Destinations graphic.
Metaprogramming with R
I gave this talk at a monthly data analytics meetup, on integrating R formulas with Excel sheets to bring transparency to non-R users.
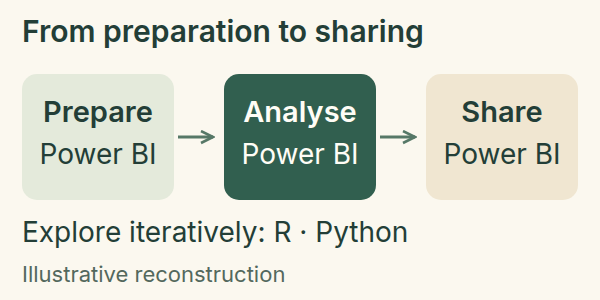
Tools for Analysis and Communication
I presented the tools we were using for analysis and communication, showing how data preparation, modelling and visualisation connect with sharing results.
Papers and briefings
An Improved Data Exploration Pipeline
Written for management, this paper explains improvements to data preparation and exploration, combining changes already made with recommendations for further development. The excerpt focuses on automated retrieval, structured data and validation.
From Data to a Story
This presentation for management covered the challenges facing our data pipeline, the solutions we had implemented and the work still to do to automate parts of it. Its visual excerpt follows the path from data sources to outputs for different audiences.
Recognition
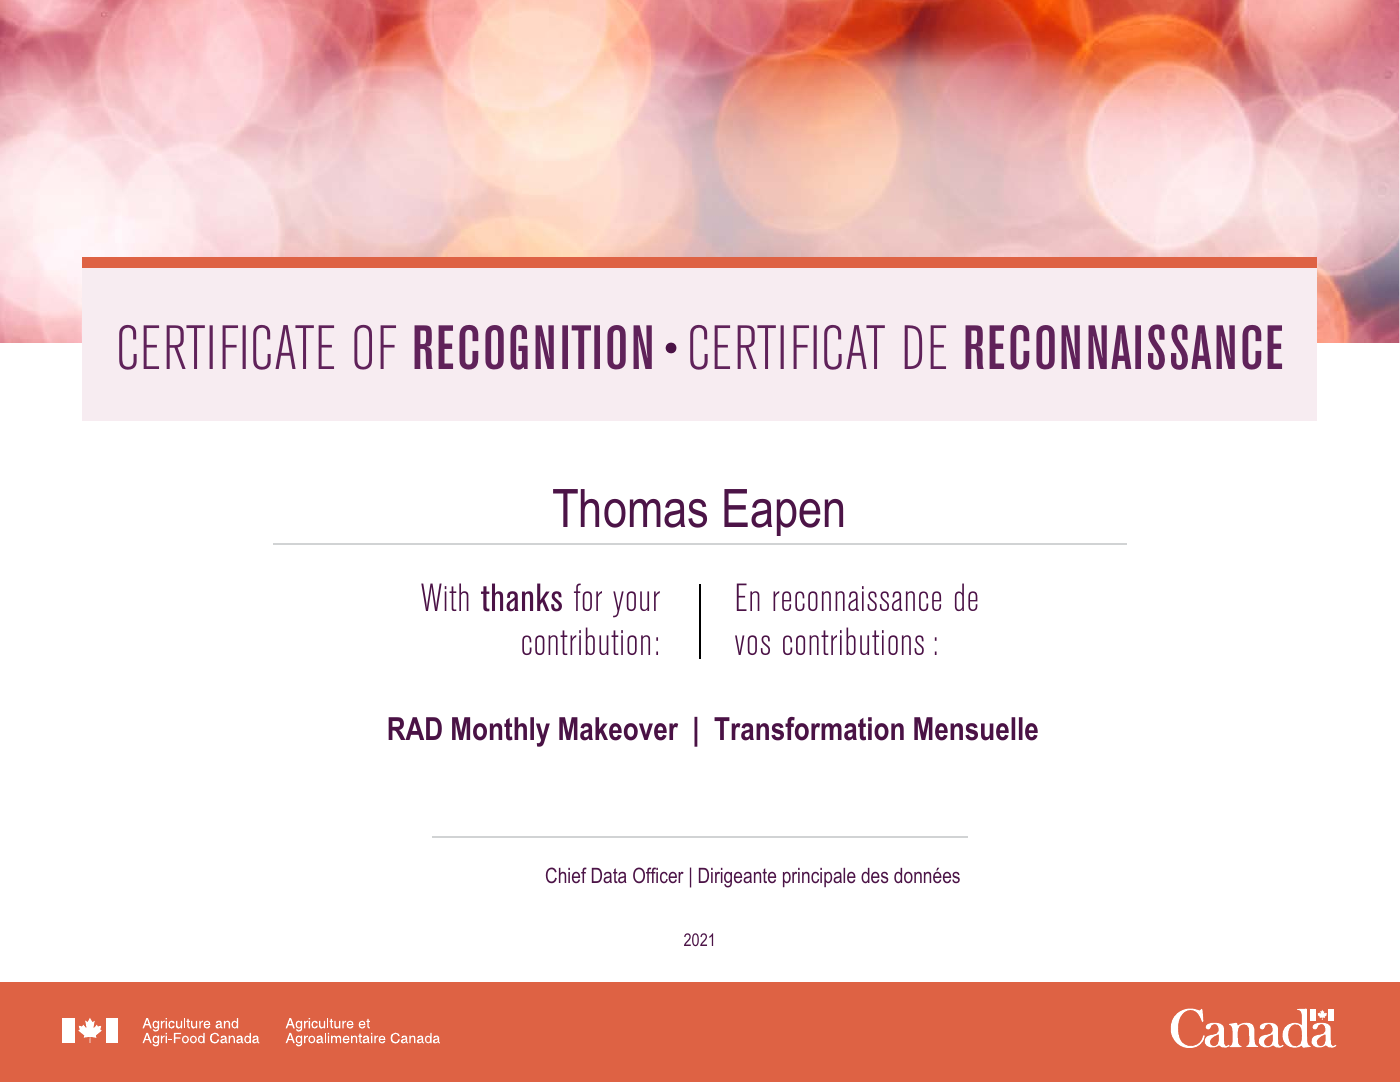
As part of the Makeover Exercise run by the Office of the Chief Data Officer, I made three submissions, which were highly rated. I was named the “Tool Wiz Champion” of 2021 and received a Certificate of Recognition for my contribution.
Training / Conferences
Posit Conference — Chicago, 2023
I attended the Posit R/Python Conference in Chicago in September 2023. This was a chance to interact with and listen to luminaries in data science, machine learning and statistics.
At the conference, I attended two one-day workshops, on Quarto and ggplot2.

Ongoing training
I have completed multiple DataCamp and Udemy courses on:
- Data science.
- Graphic design.
- R.
- Python.
- Web design.
- Various other topics.