Thomas Eapen · Selected presentation slides
Metaprogramming with R
I explored how R could automate processing while keeping calculations transparent to colleagues who use Excel.
Excel and R: Friends or Enemies? · A monthly data analytics meetup · 2020
4 selected slides · one-page overviewSelect a slide to enlarge itSlide order follows the original presentation
01
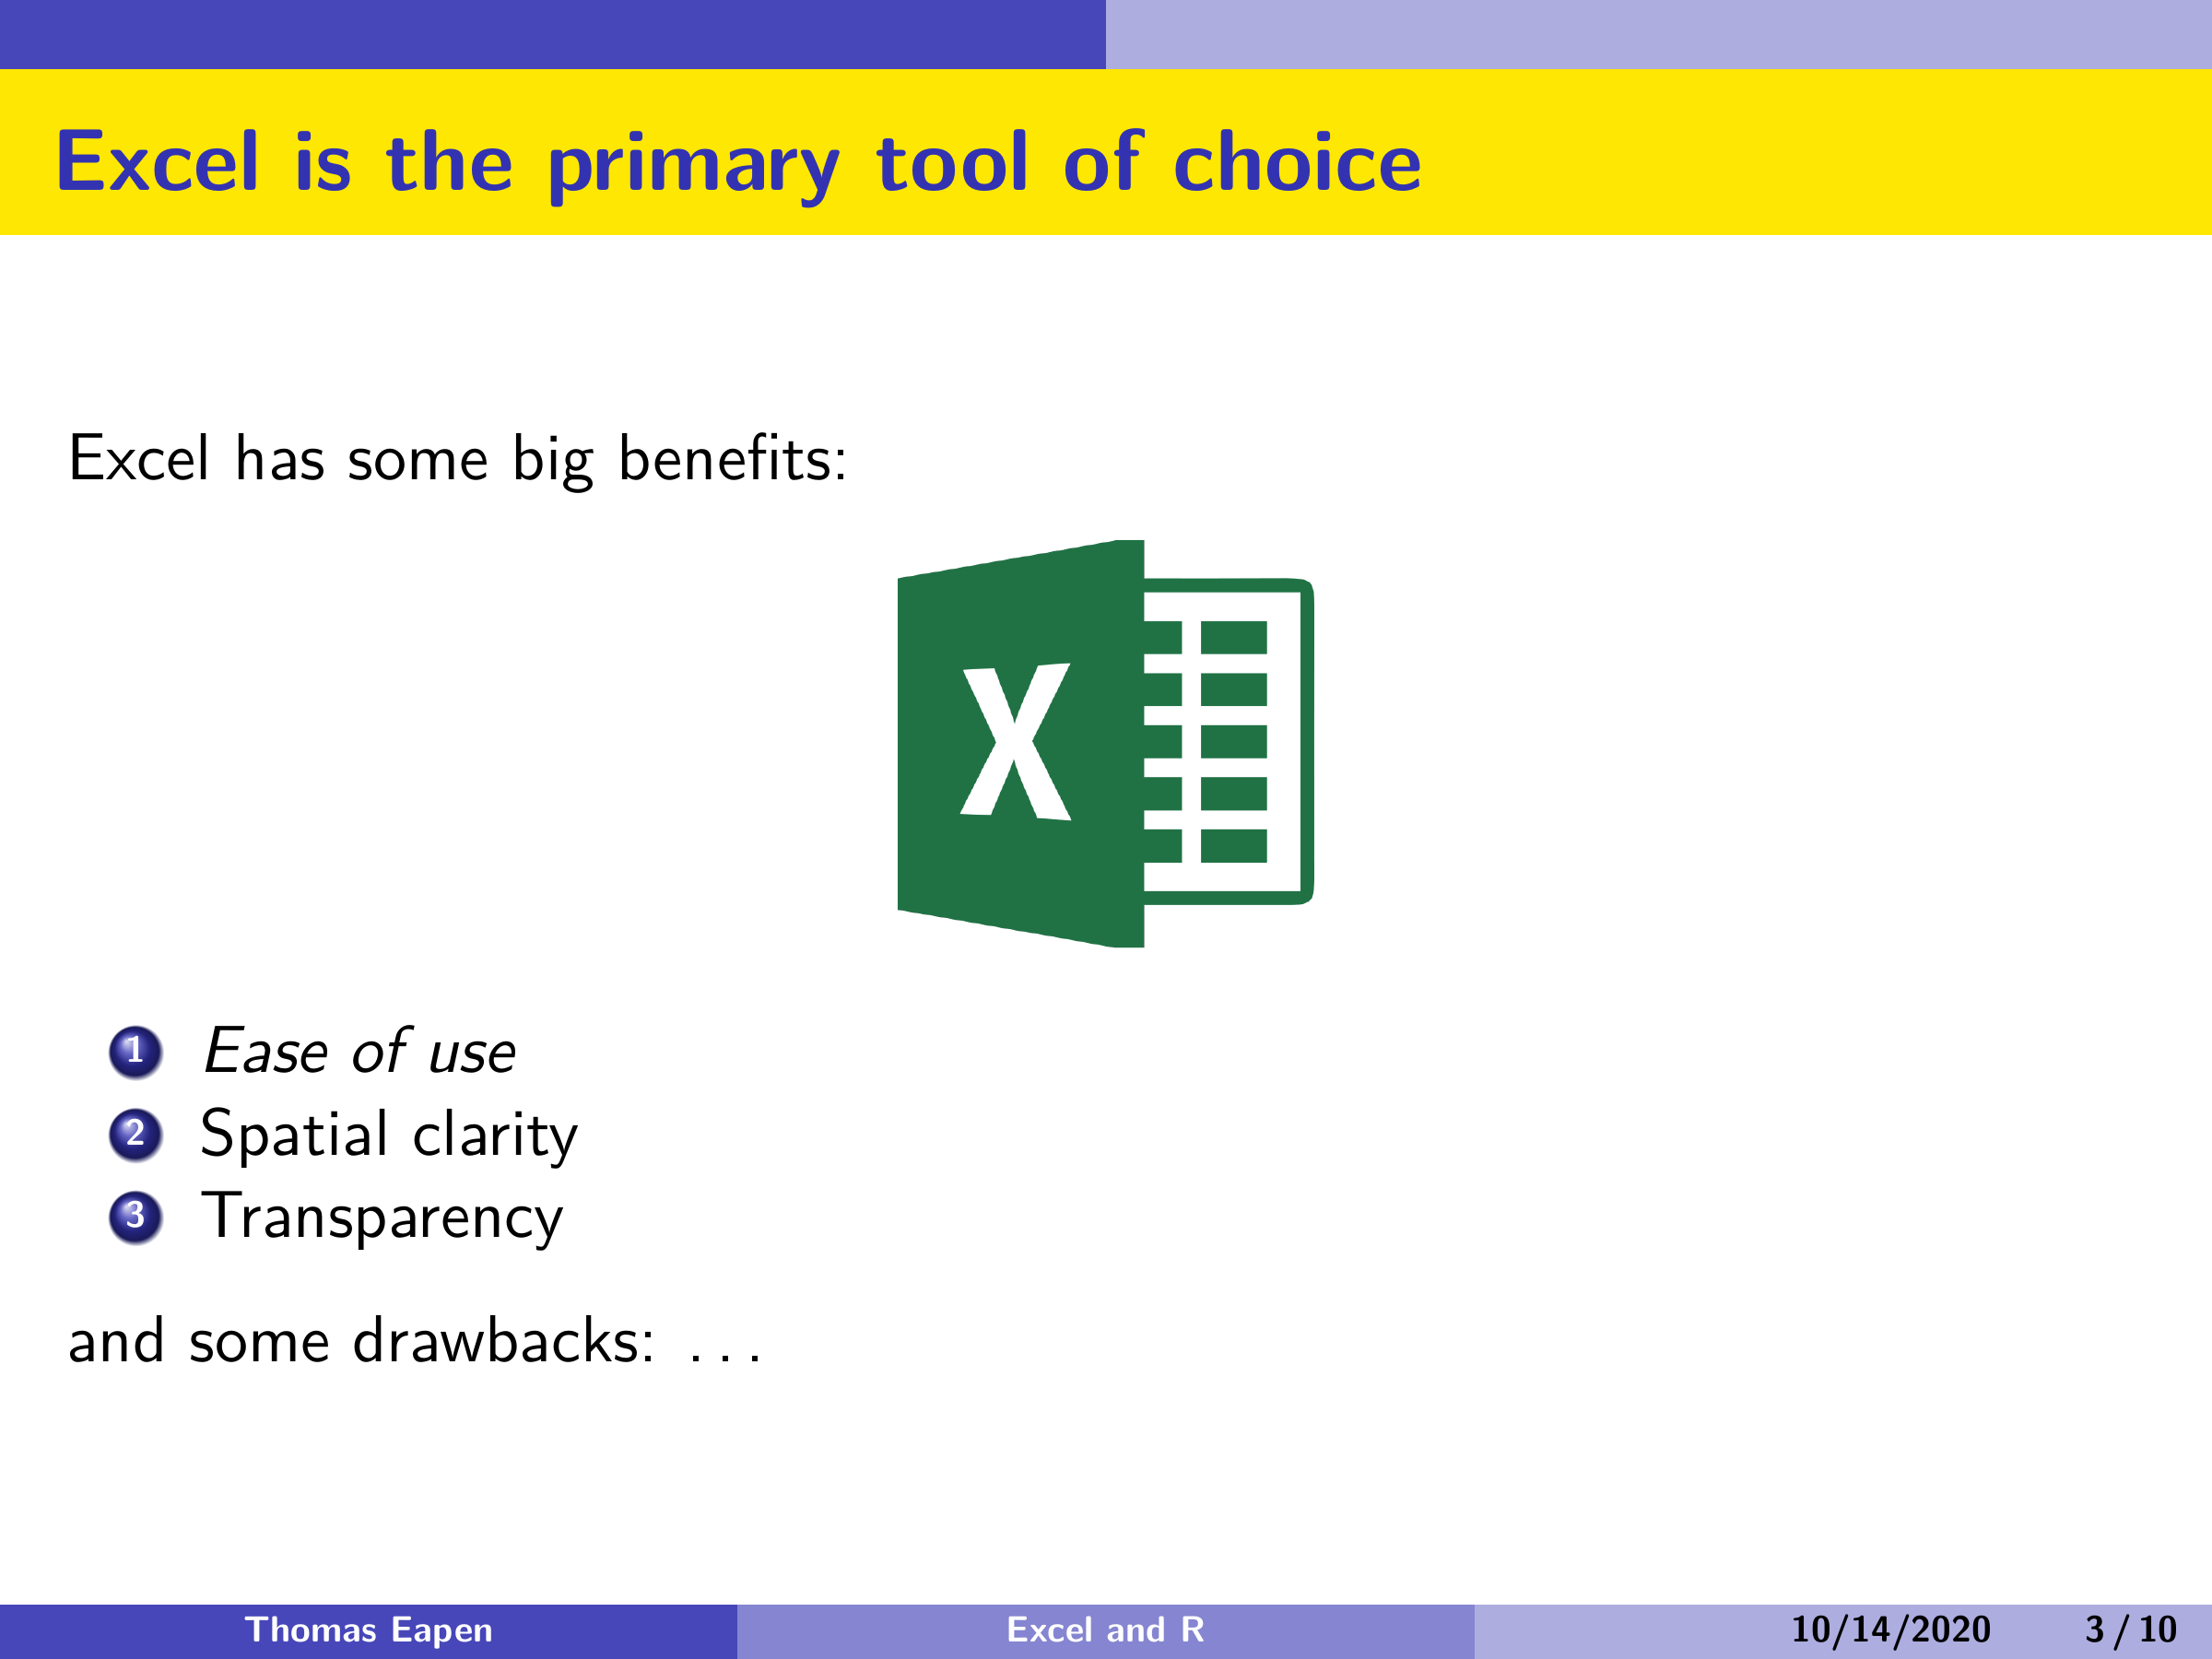
Keep Excel’s strengths
 Enlarge slide ↗
Familiar tools offer ease of use, spatial clarity and transparency.
The presentation starts from Excel’s practical strengths: ease of use, spatial clarity and transparency for the people working with the data.
02
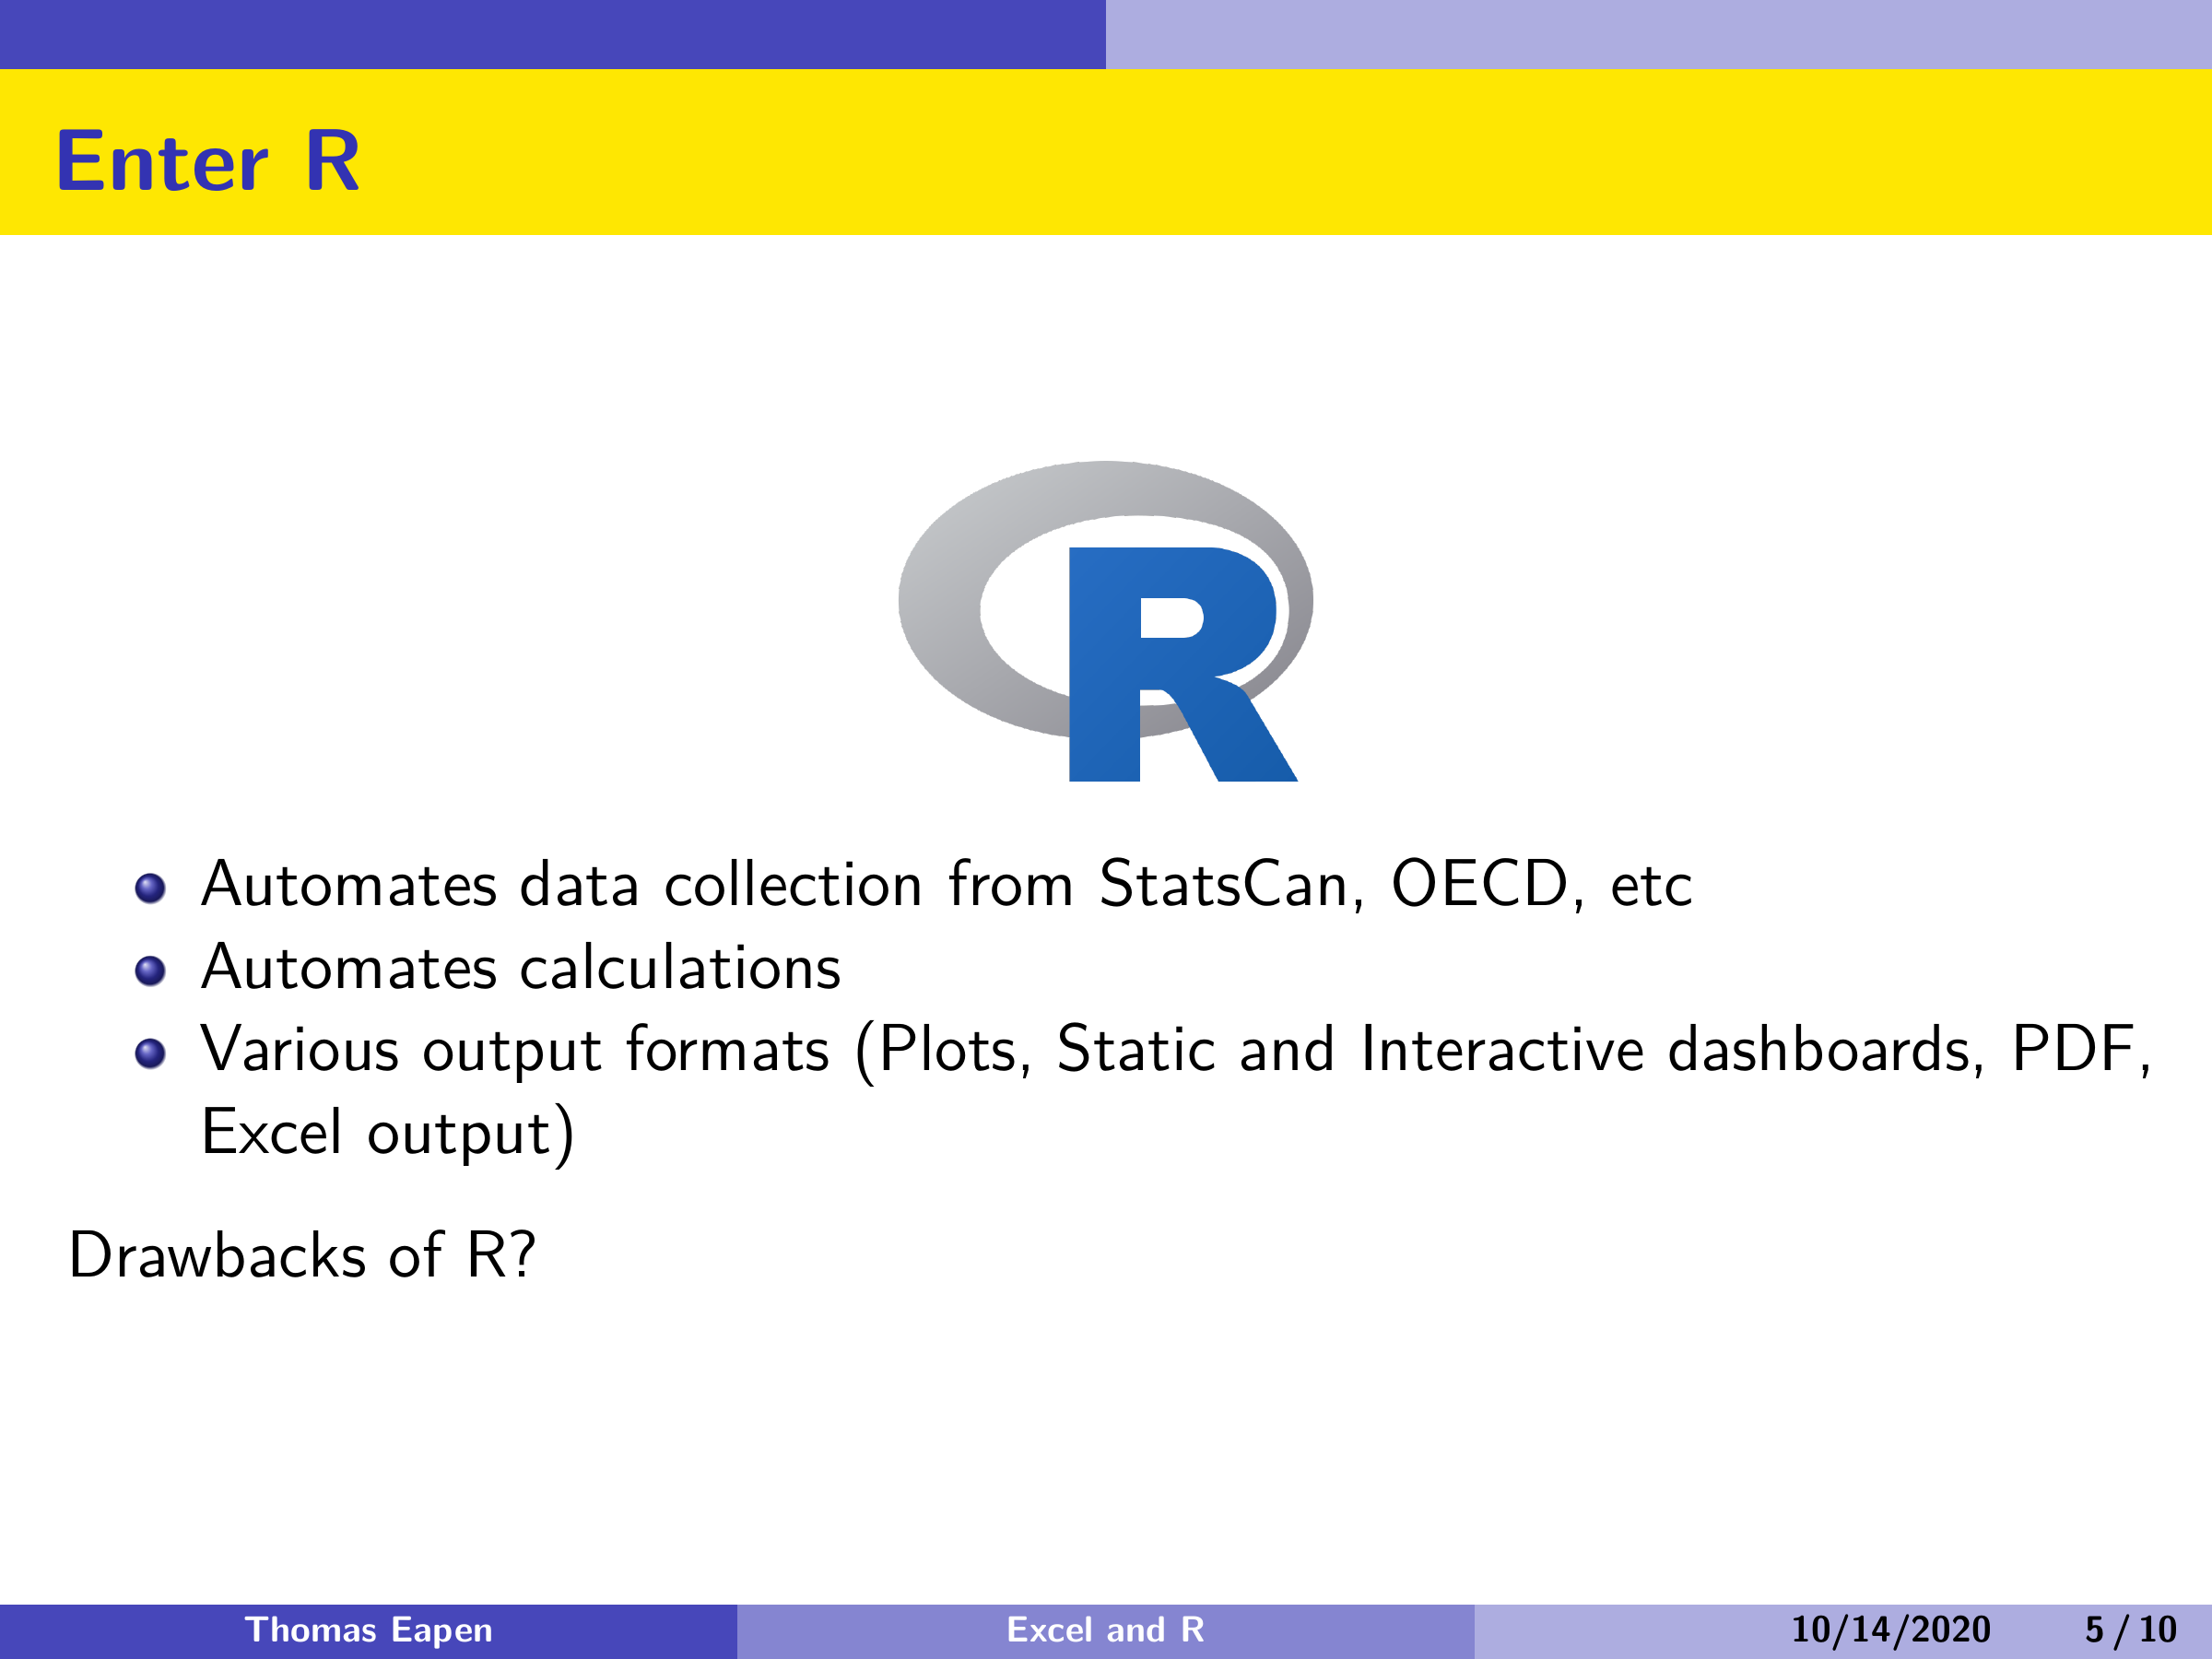
Automate with R
 Enlarge slide ↗
Retrieve data, perform calculations and generate different output formats.
R is introduced for programmatic collection from sources such as Statistics Canada and OECD, automated calculations, and outputs including plots, dashboards, PDFs and Excel files.
03
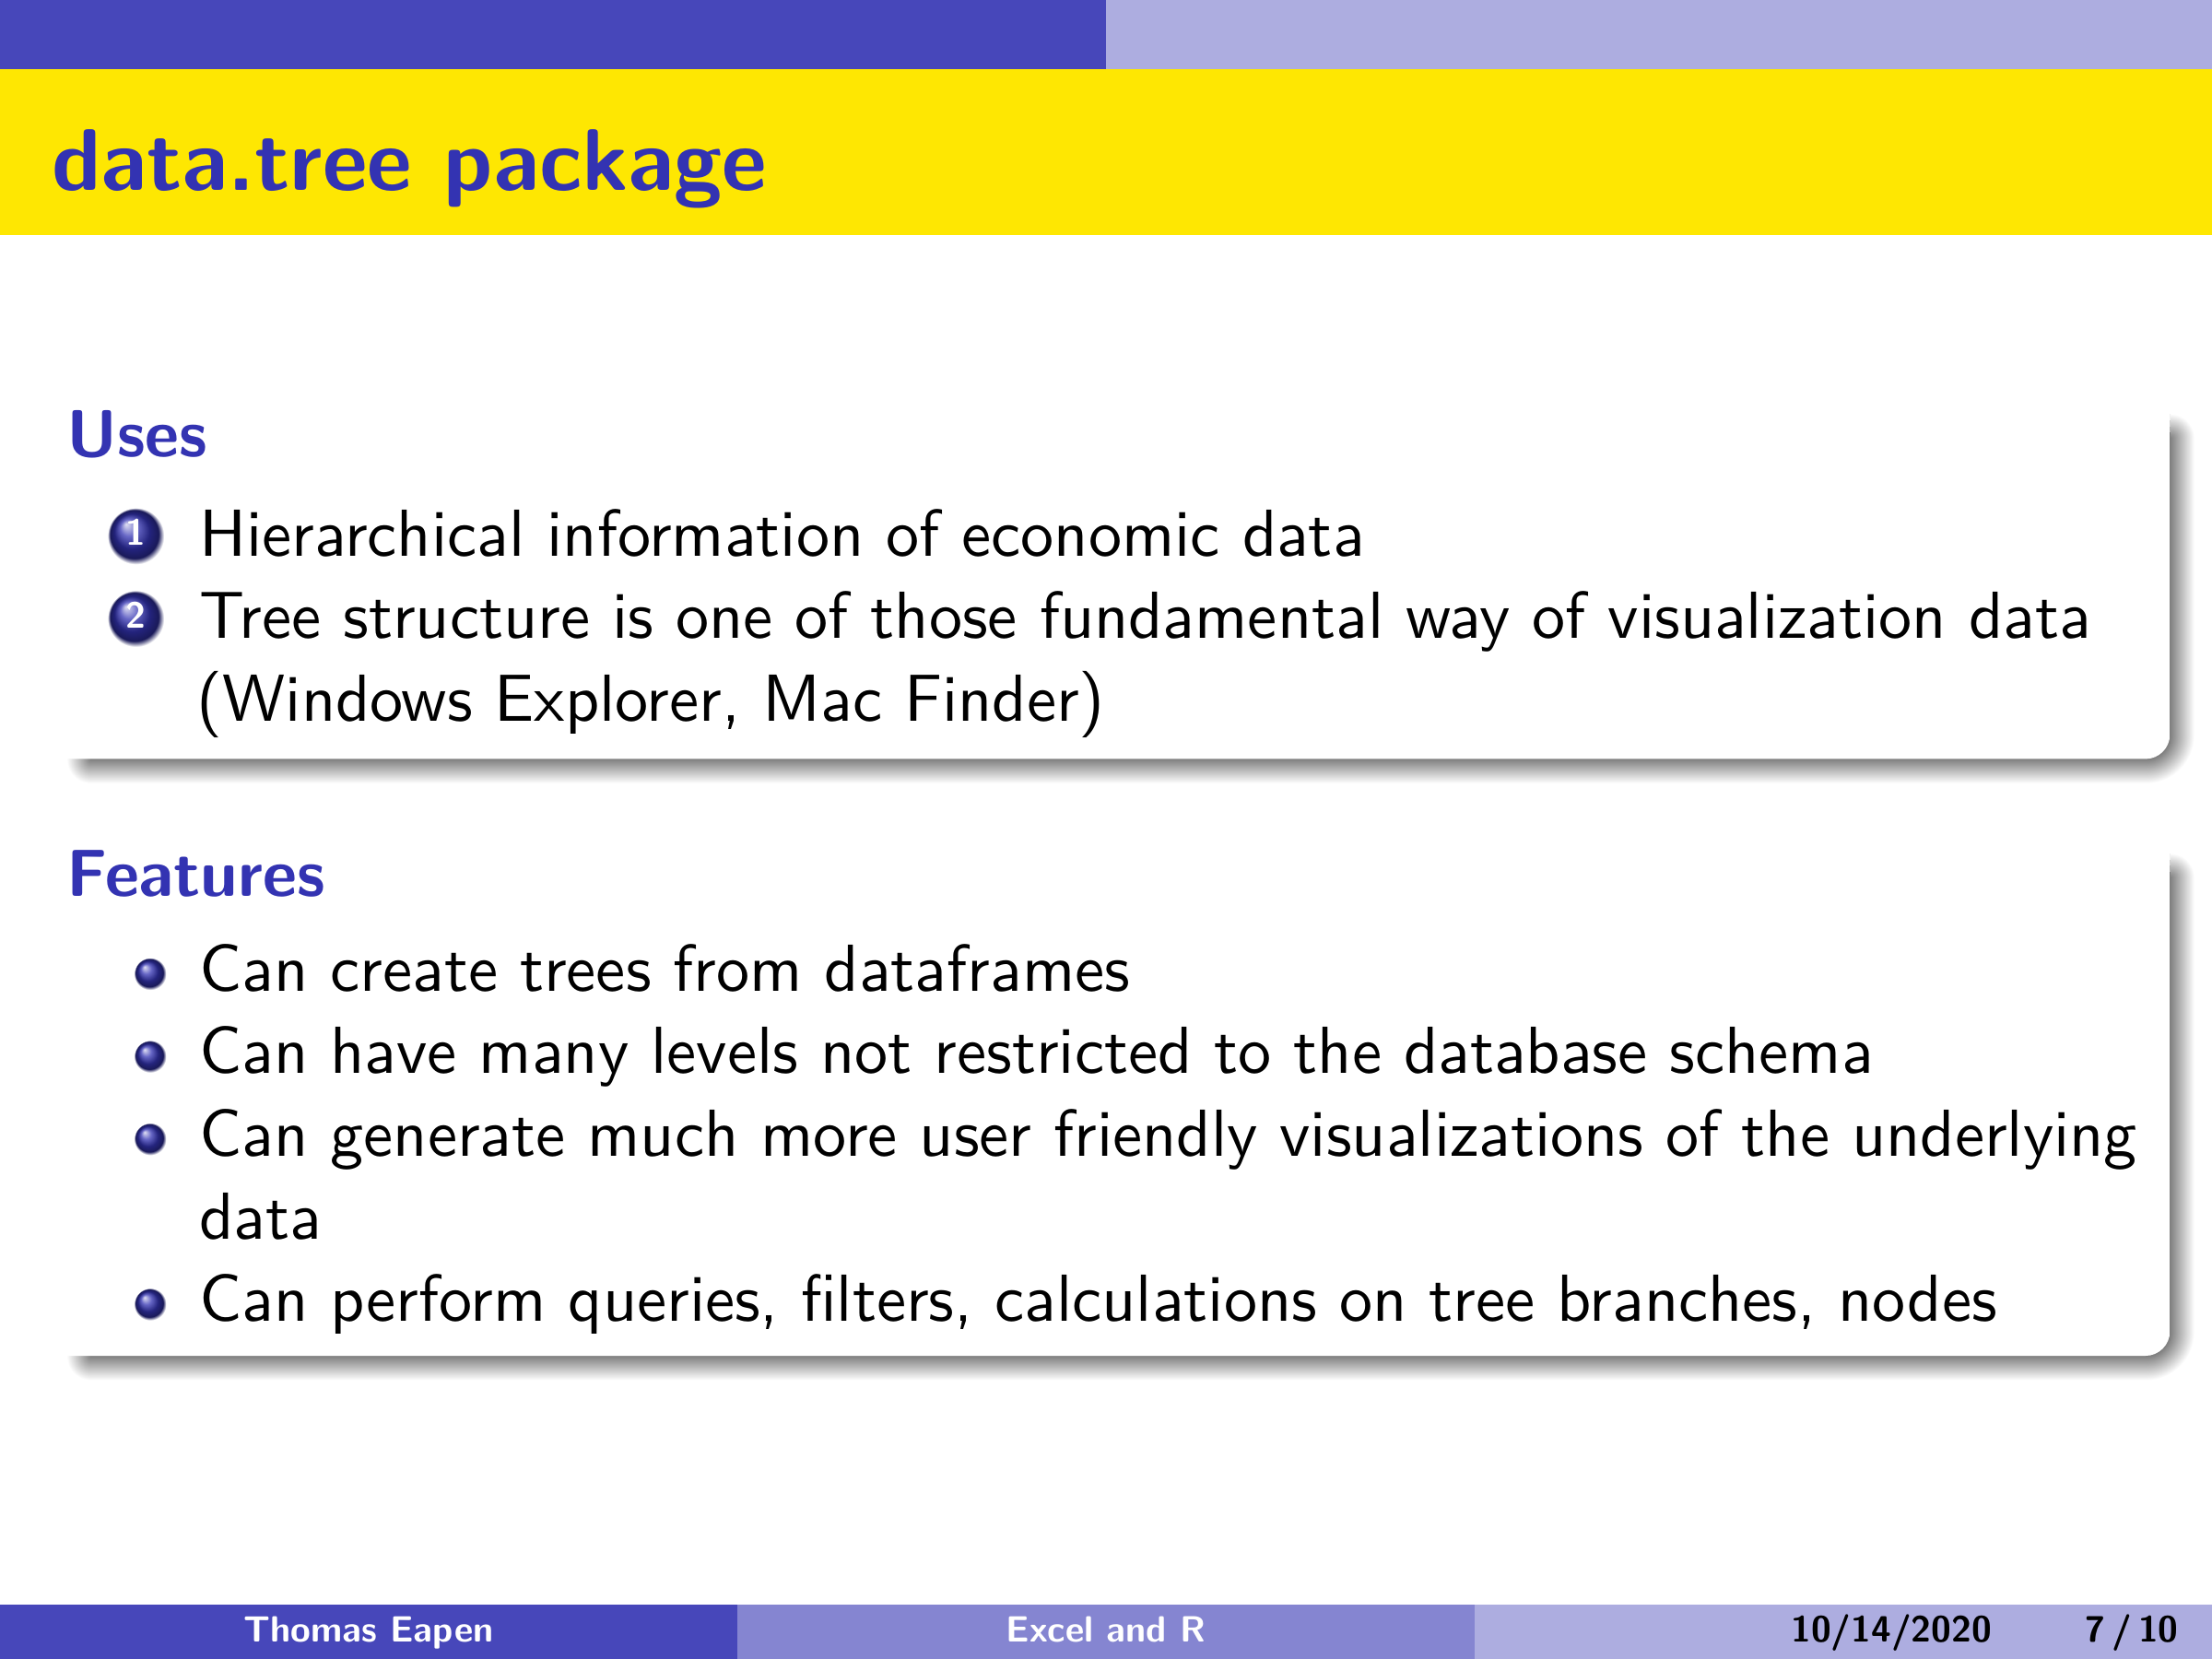
Give data a hierarchy
 Enlarge slide ↗
Use data.tree to organise information and work with branches and nodes.
The data.tree package is presented as a way to build hierarchical structures from data frames, generate readable views, and query, filter or calculate across tree branches and nodes.
04
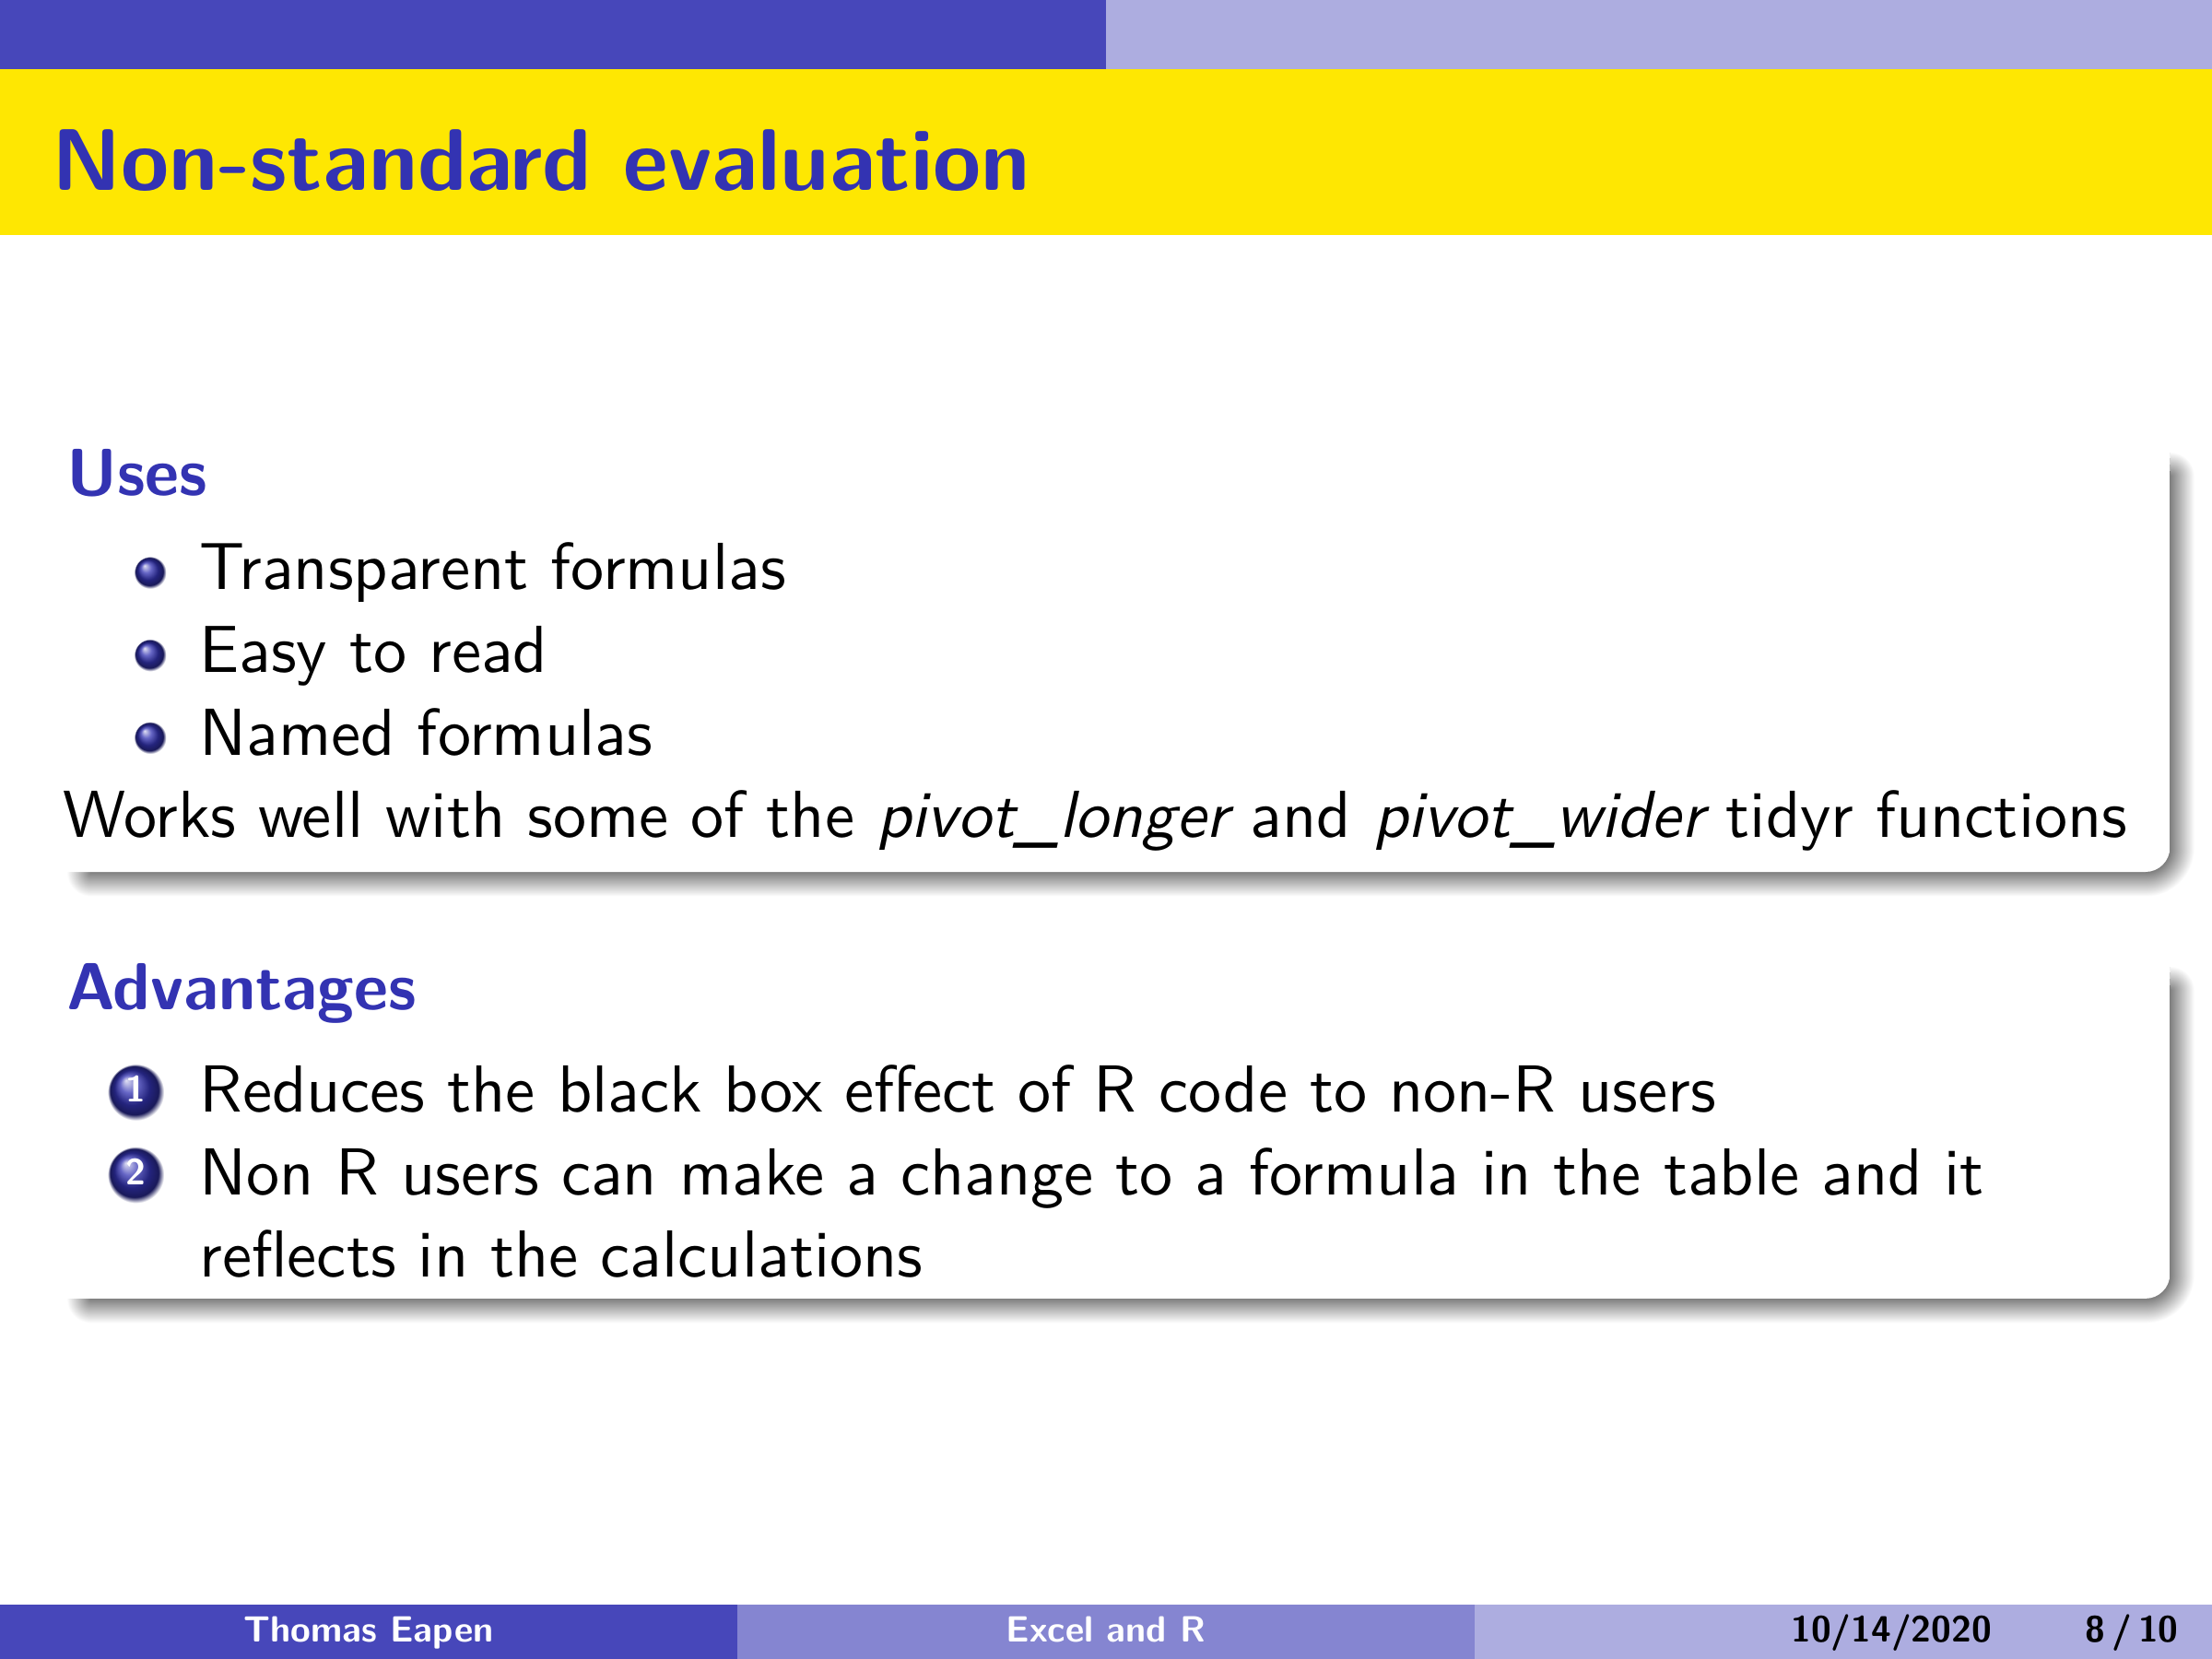
Keep formulas readable
 Enlarge slide ↗
Named formulas help non-R users understand and adjust calculations.
The non-standard evaluation slide describes transparent, named formulas that work with tidy reshaping. A formula changed in a table can be reflected in calculations, reducing the black-box effect for non-R users.