Thomas Eapen · Selected presentation slides
Makeover Exercise — Show and Tell
I presented how I built the Wheat Export Destinations graphic, from geospatial work and analysis to composition and design references.
Monthly Makeover · Maps & Infographics
3 selected slides · one-page overviewSelect a slide to enlarge itSlide order follows the original presentation
01
Build the graphic in layers
 Enlarge slide ↗
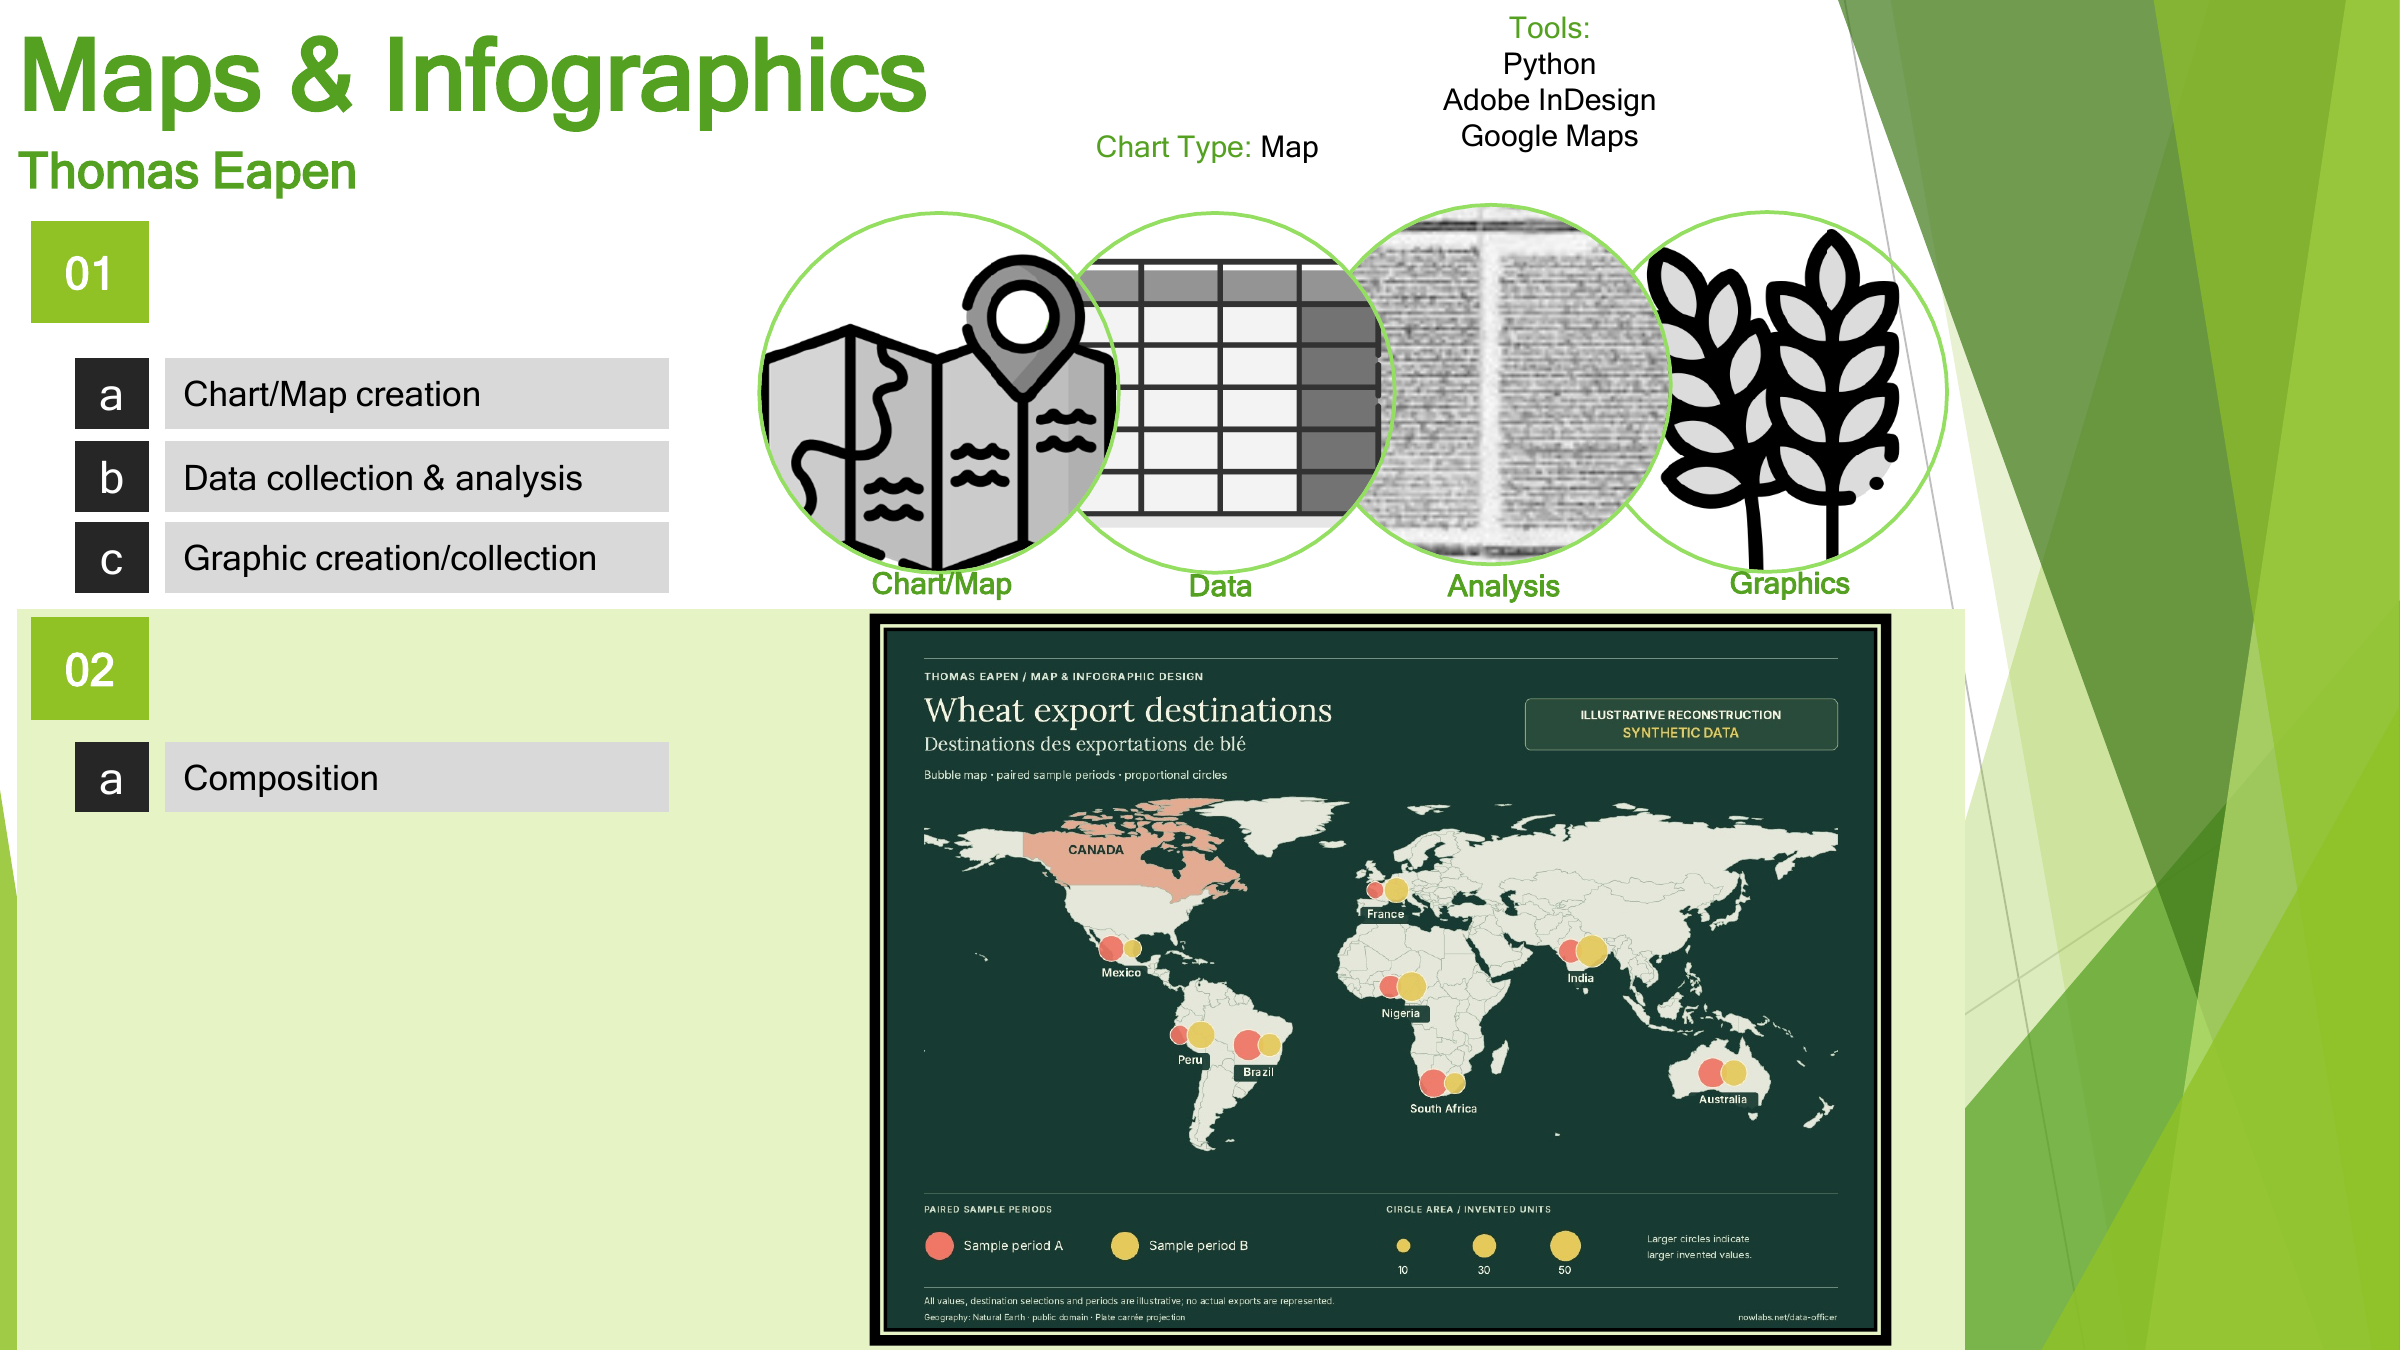
Mapping, analysis and composition come together; the displayed wheat map uses synthetic data.
The slide separates chart and map creation, data analysis, graphic preparation and final composition. Its wheat map is an illustrative reconstruction with invented values and sample periods.
02
Choose the mapping technique
 Enlarge slide ↗
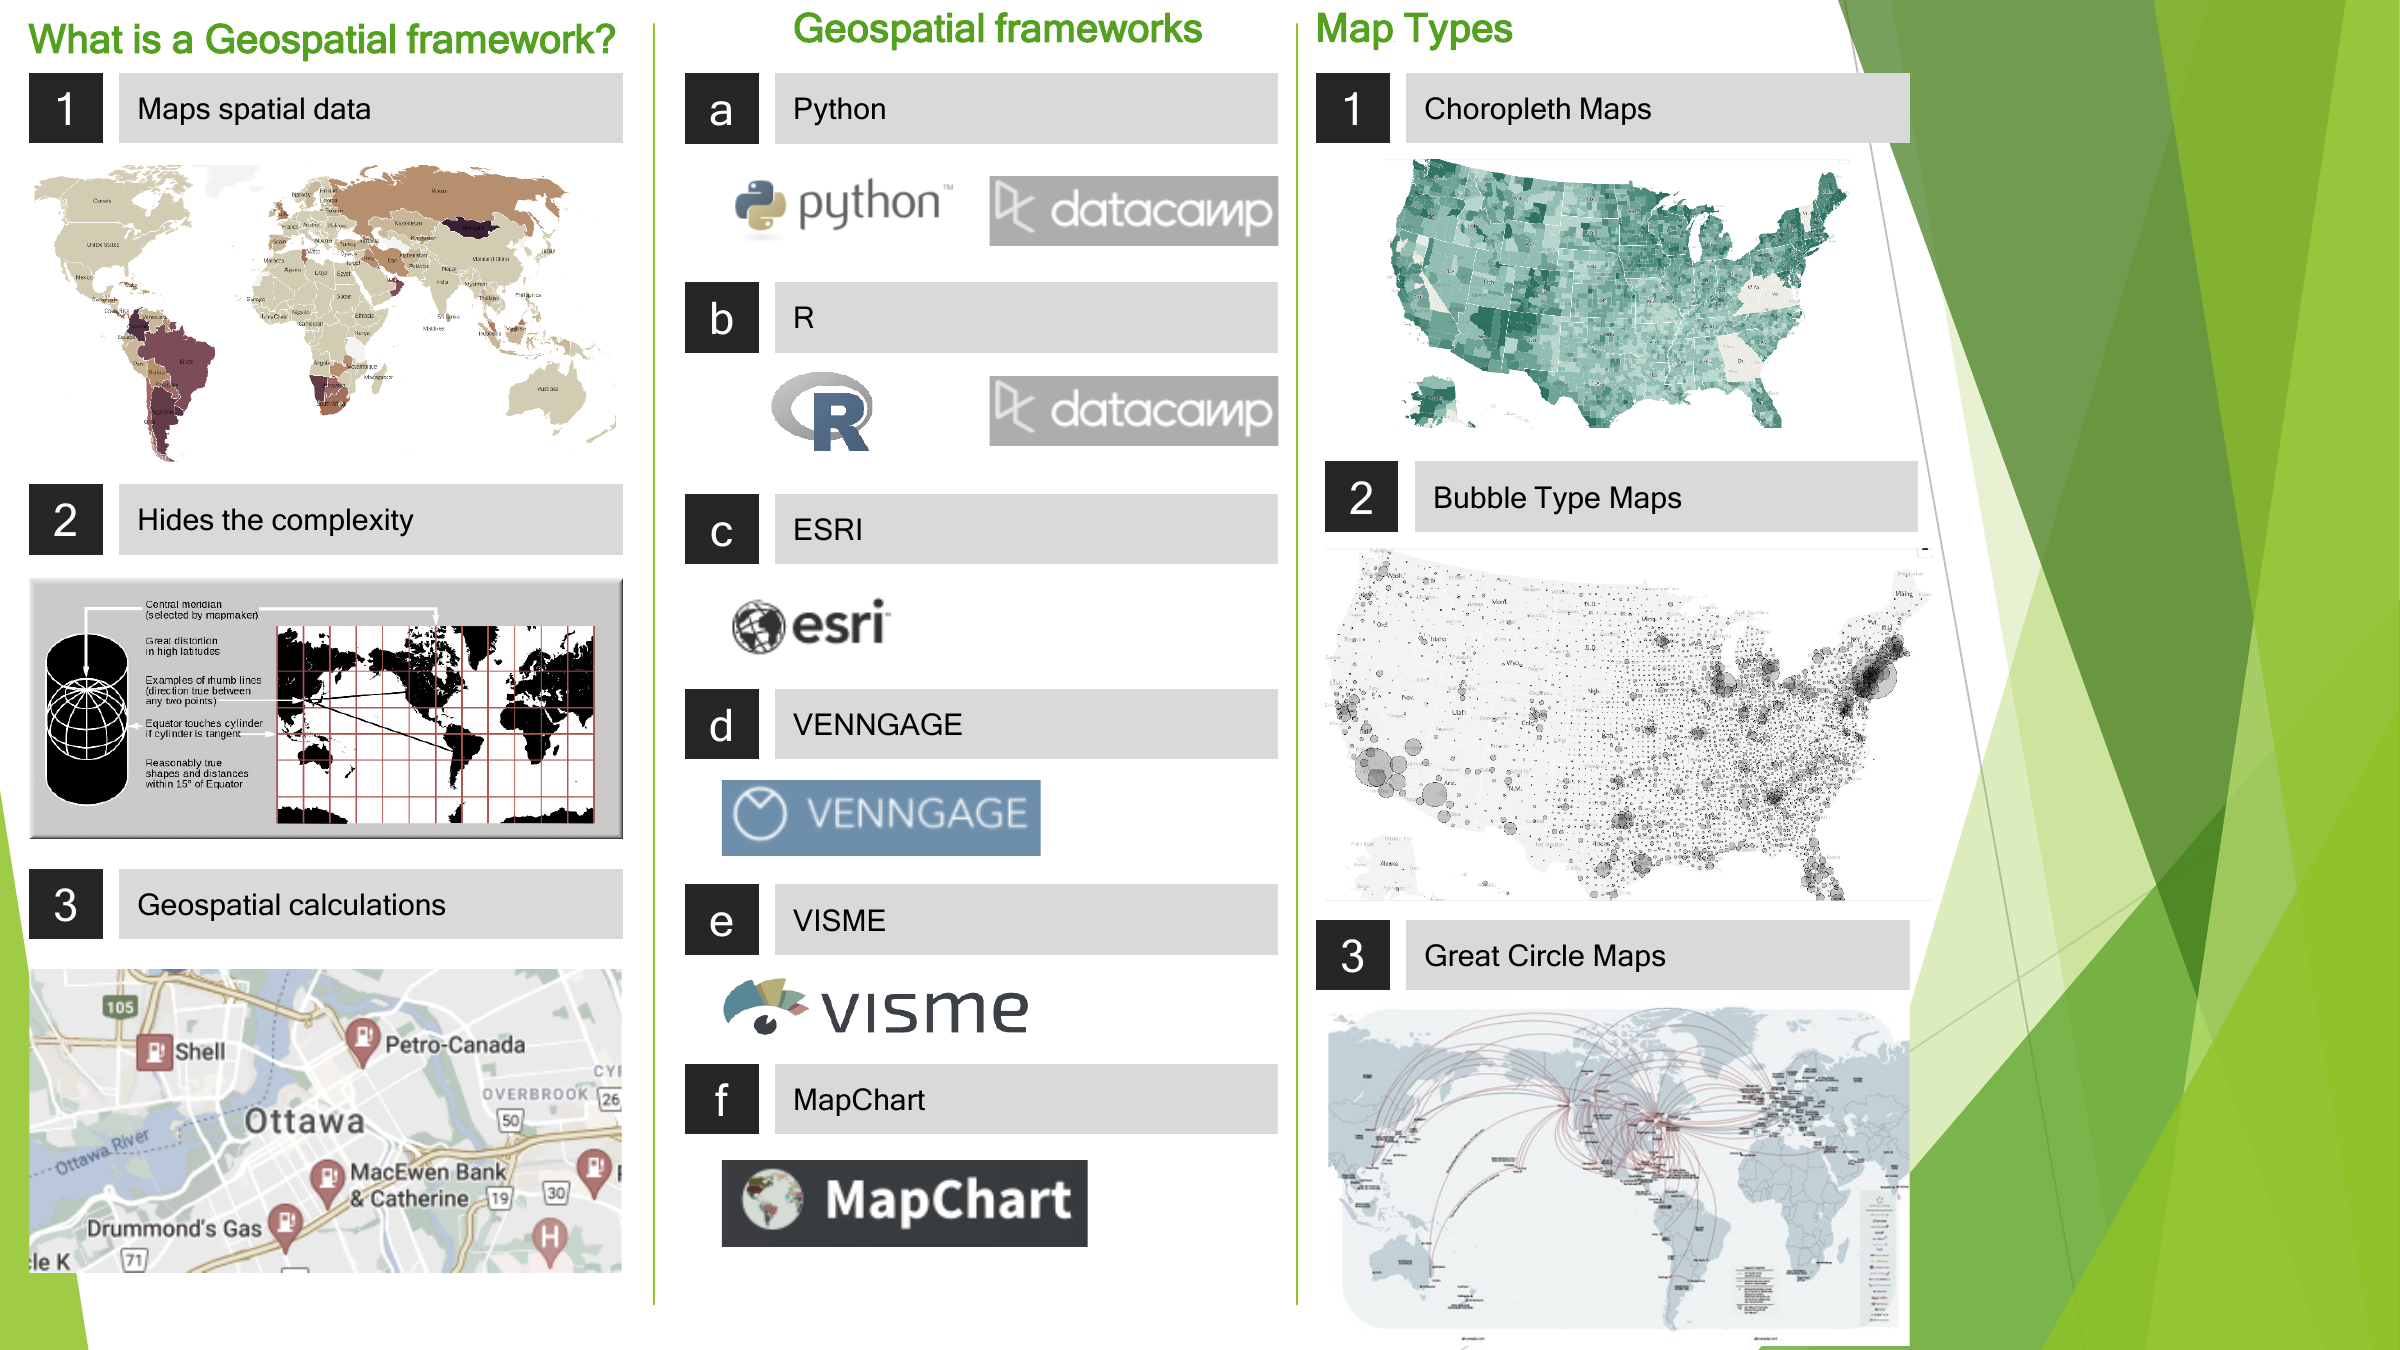
Choropleth, bubble and great-circle maps serve different communication needs.
A geospatial framework maps spatial data, hides the complexity and handles geographic calculations. The slide lists tools and illustrates choropleth, bubble and great-circle map types.
03
Compose and keep learning
 Enlarge slide ↗
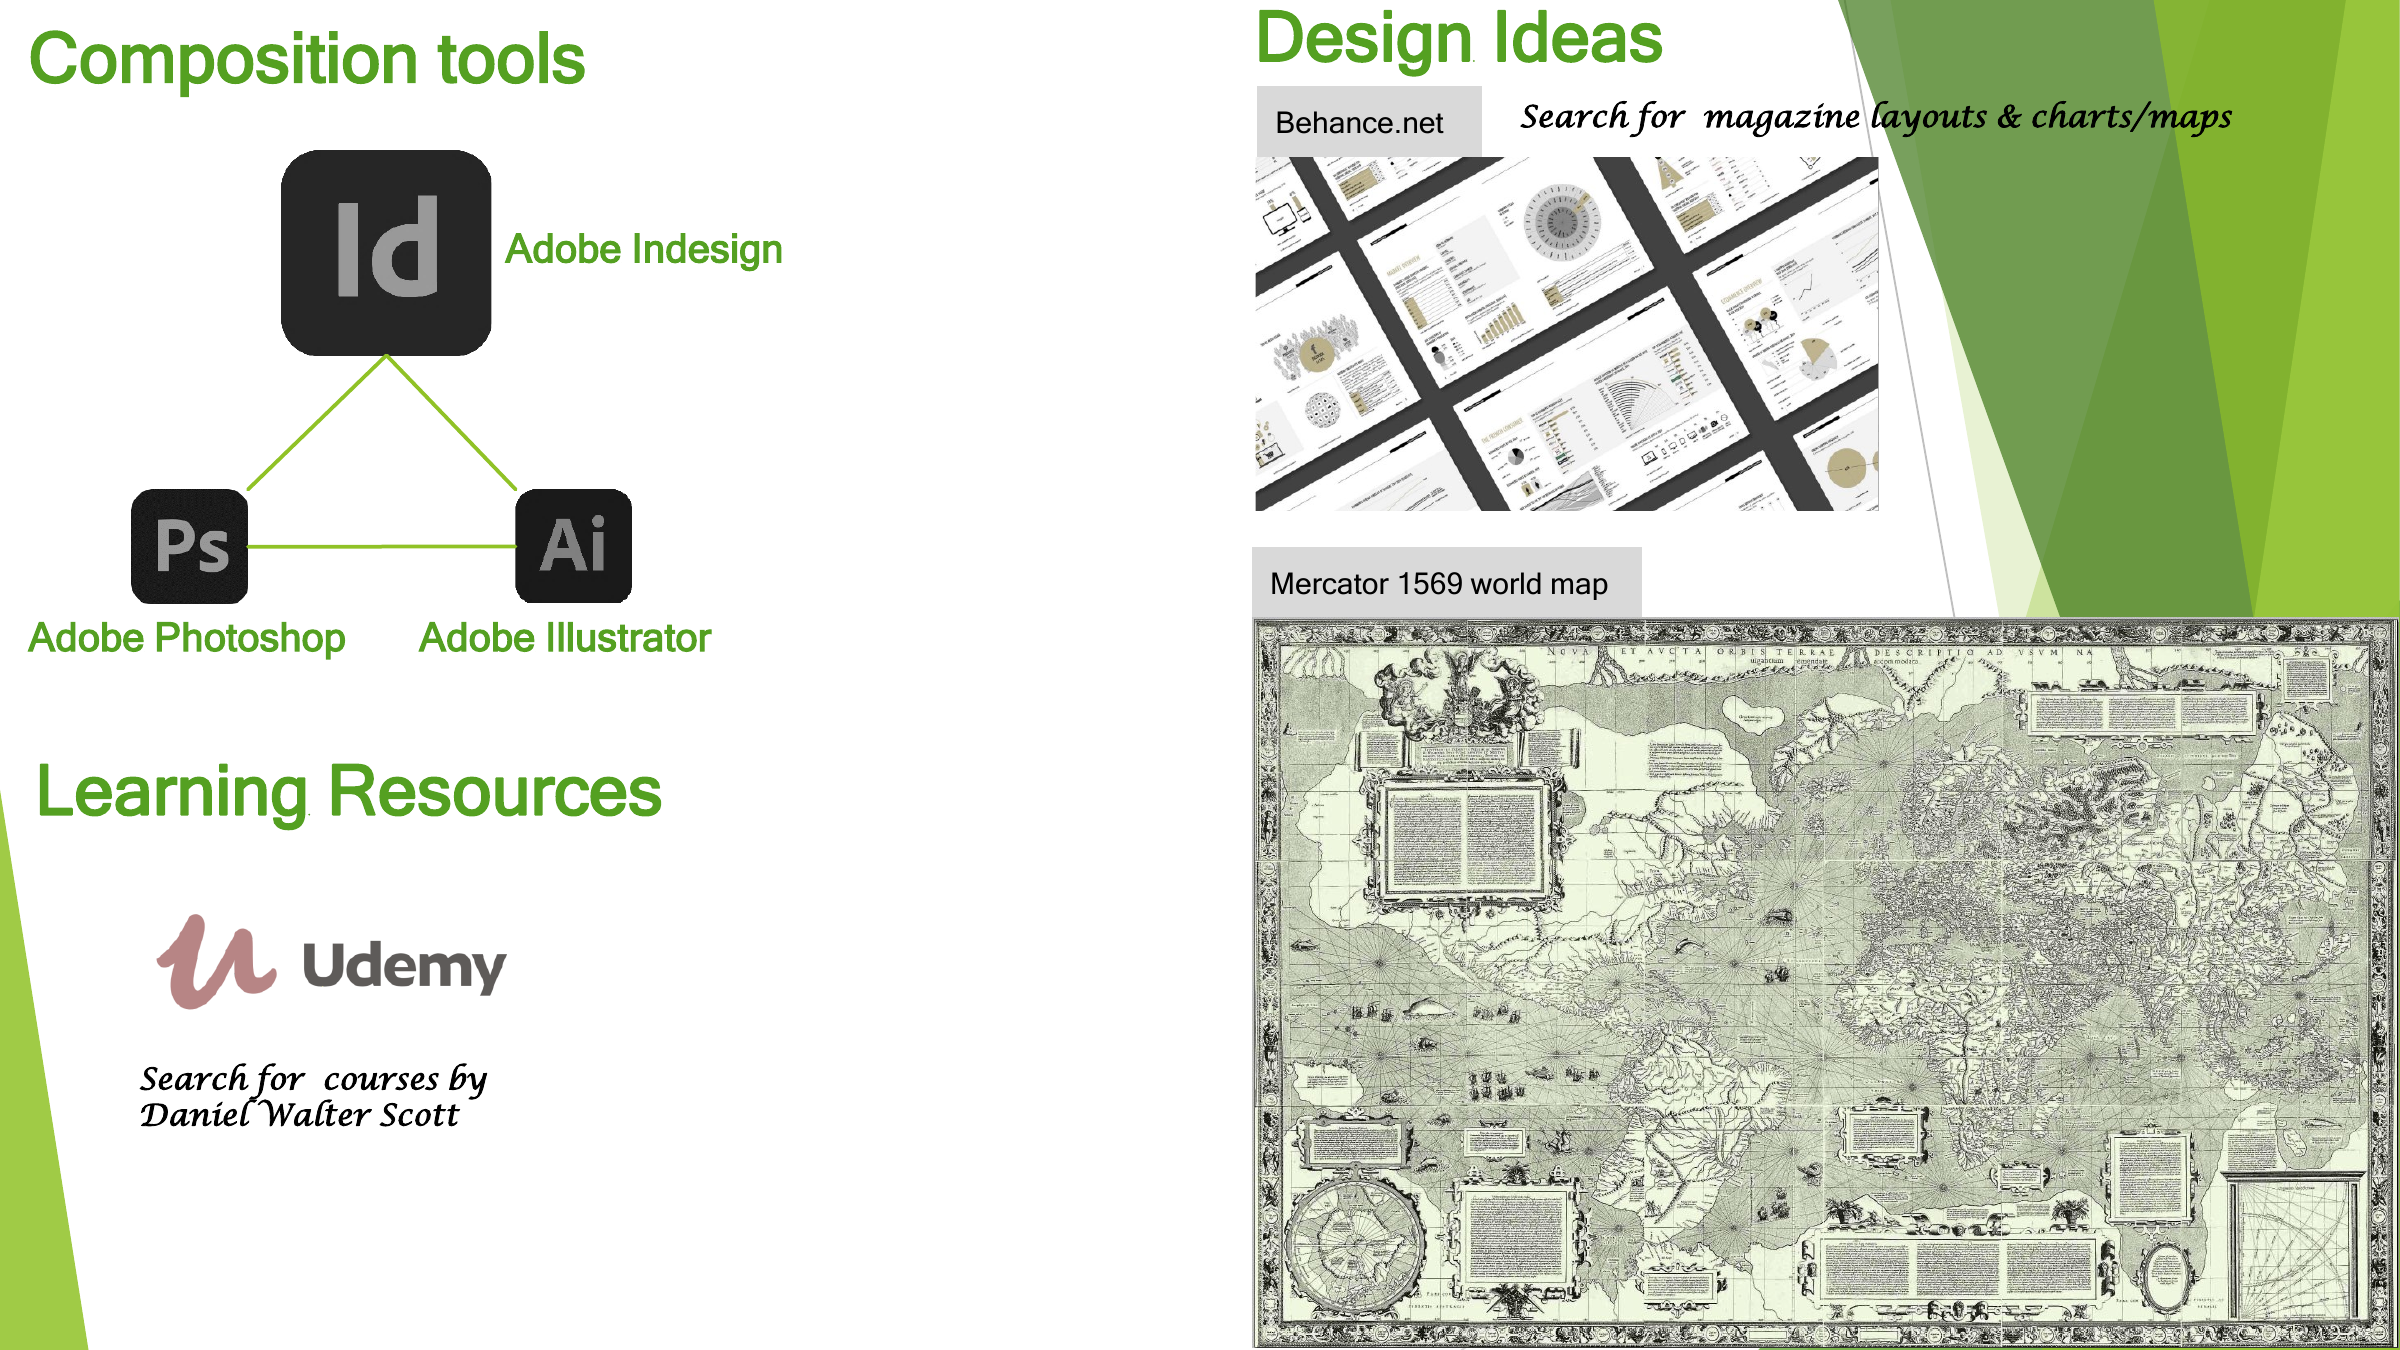
Use design tools and references to turn analytical material into a readable graphic.
Adobe InDesign, Photoshop and Illustrator support composition. The historical references include Udemy coursework by Daniel Walter Scott, layouts found through Behance and a Mercator world map.